User Analytics: Retention Cohort
- 15 Mar 2024
- 3 Minutes to read
User Analytics: Retention Cohort
- Updated on 15 Mar 2024
- 3 Minutes to read
Article Summary
Share feedback
Thanks for sharing your feedback!
The ability of a website or mobile app to keep visitors coming back over time is referred to as user retention. It is a gauge of how effectively a digital platform keeps its user base, and encourages users to utilize the platform or service frequently. A successful and engaging platform will normally have a high user retention rate, whereas a service that fails to offer value to its users will likely have a poor user retention rate.
Retention is an engagement analysis feature that breaks down users' event behavior across all channels such as web, application, API, etc, starting from their first visit and analyzing through time.
Creating a User Retention Report
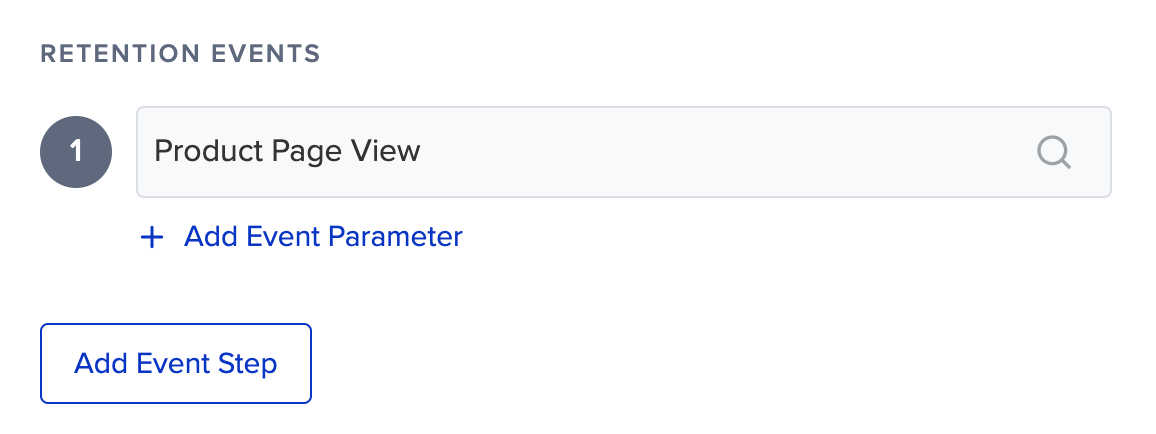
To create a user retention report, you should first select the event you want to analyze. At this stage, you can add event parameters to the selected event and generate your charts according to these parameters. You can also select more than one event for retention analysis. Each event will have its own analysis and will appear as a separate segment in the chart.
Then, you should select a date range. You can create the retention analysis within time periods such as one day, the last 30 days, last year or within the date range that you specify.
Users could use your services from different sources like the web, or mobile, or you can pass your users' data from your other sources through an API. Source selection enables you to set your retention analysis from specific sources.
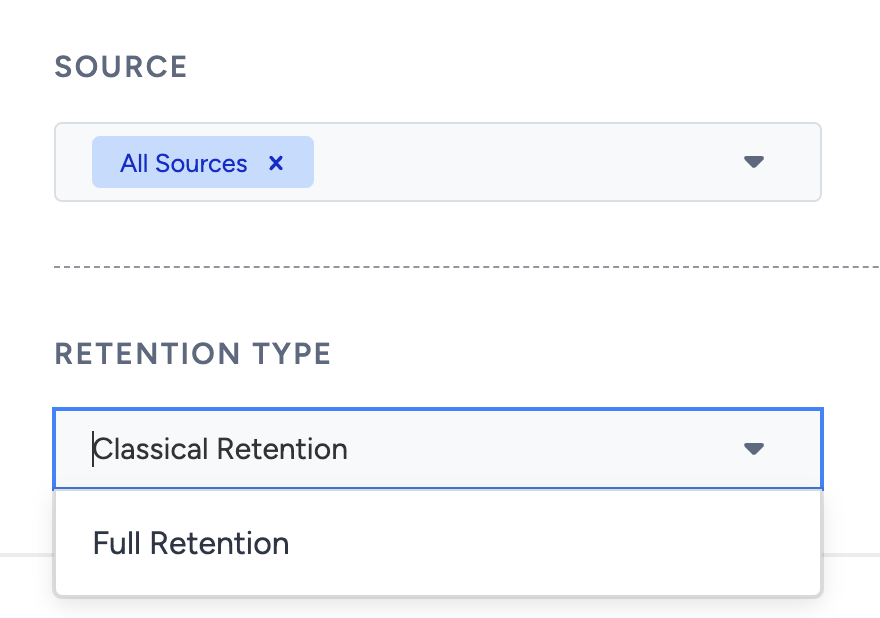
You can select a calculation method: Full or Classical.
- Full Retention: Considers the users who have not skipped a day or broken the retention cycle.
Imagine an app has 100 new users every day for 5 consecutive days during the first week of the month (Week 0). That is a total of 500 users. On Saturday, which is the 6th day of the month, 60 users come back. During the subsequent week (Week 1), we see that 30 unique users come back on the 9th day, and 40 users on the 13th day. We will count this as 70 unique users returning for the week. In the third week (Week 2), 20 users come back, all on the 21st day. That makes 20 users the total of the week. Therefore, Week 1 retention is 70/500 or 14% while Week 2 retention is 20/500 or 4%.
You can consider the users who have not skipped a day or broken the retention cycle. For example, if a user visits your platform on Day 2, Day 3, Day 4, and Day 6 in a week, this user is considered as a fully retained user only until Day 4 (included) as they had consecutive visits without any interruption.
| Day 1 | Day 2 | Day 3 | Day 4 | Day 5 | Day 6 | Day 7 | |
|---|---|---|---|---|---|---|---|
| Session | No | Yes | Yes | Yes | No | Yes | No |
| Retained | No | Yes | Yes | Yes | No | No | No |
- Classical Retention (Day N Retention: Considers the percentage of new users who come back to your platform any day regardless of any other visit or session on the following days. For example, if a user visits your platform on Day 6, they are considered as retained for Day 6.
The following table also illustrates a user's visits and whether they are retained or not. They visit on Day 1, 2, 3, and 5, and Day 4 is not counted as a retained day. However, when they come back on Day 5, we will recount them back (comparing to full retention, where it will not be counted anymore).
| Day 1 | Day 2 | Day 3 | Day 4 | Day 5 | Day 6 | Day 7 | |
|---|---|---|---|---|---|---|---|
| Session | Yes | Yes | Yes | No | Yes | No | No |
| Retained | Yes | Yes | Yes | No | Yes | No | No |
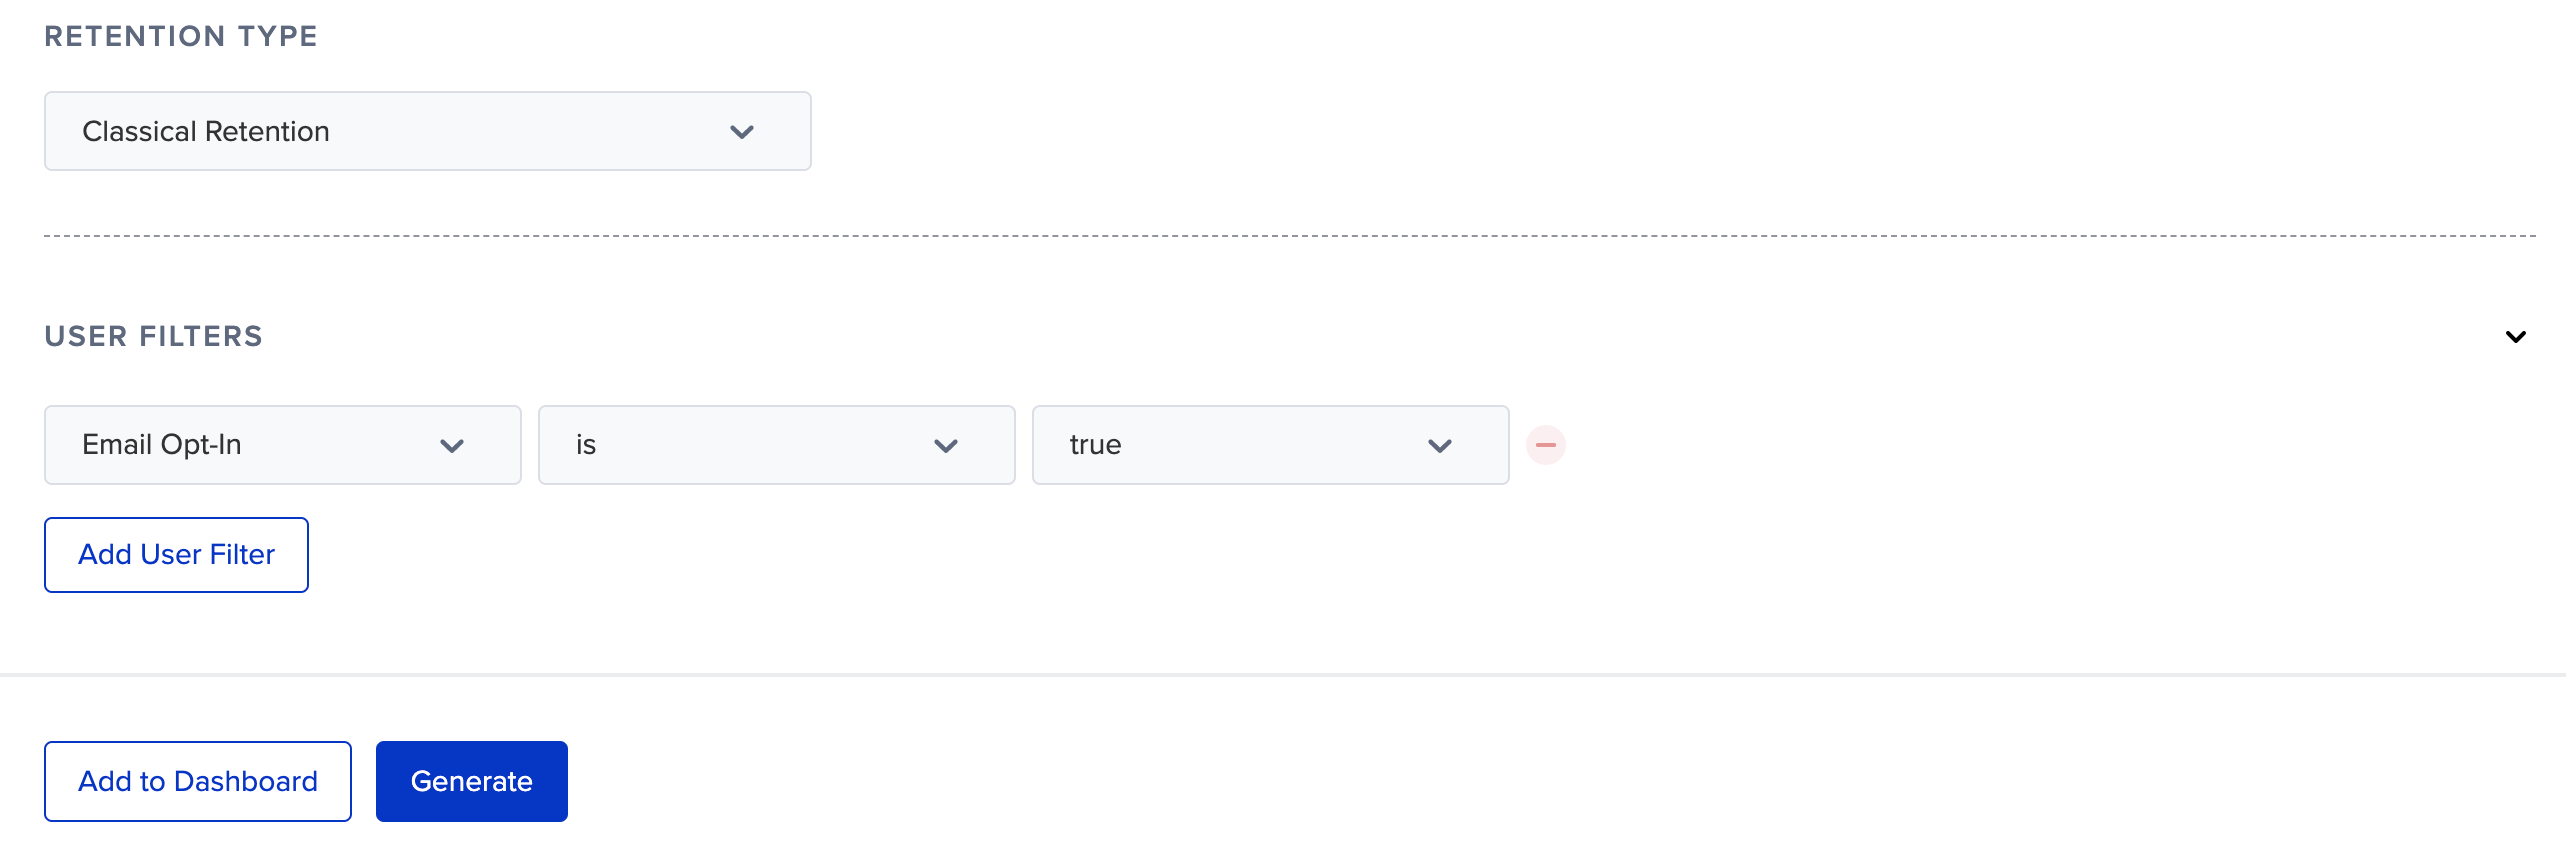
Finally, you can set your report for different user segments with user filters as an option.
Adding Your Cohorts to a Dashboard
Before or after generating your cohorts, you can also add them to an existing dashboard, or create a new one to add it.
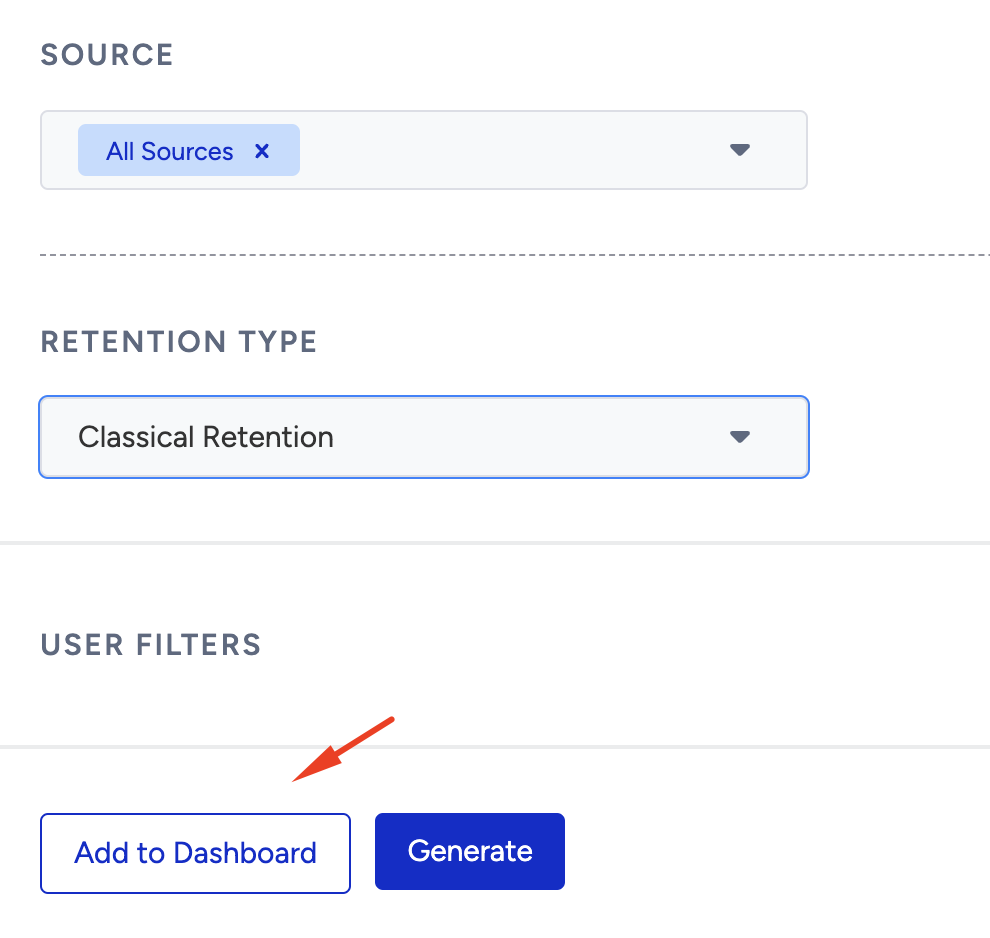
1. Click the Add to Dashboard button. A window will appear in the right hand side of the screen.
2. Choose dashboard from: Select Existing or Create New to add your flow to.
Select Existing displays the existing custom dashboards you can select from.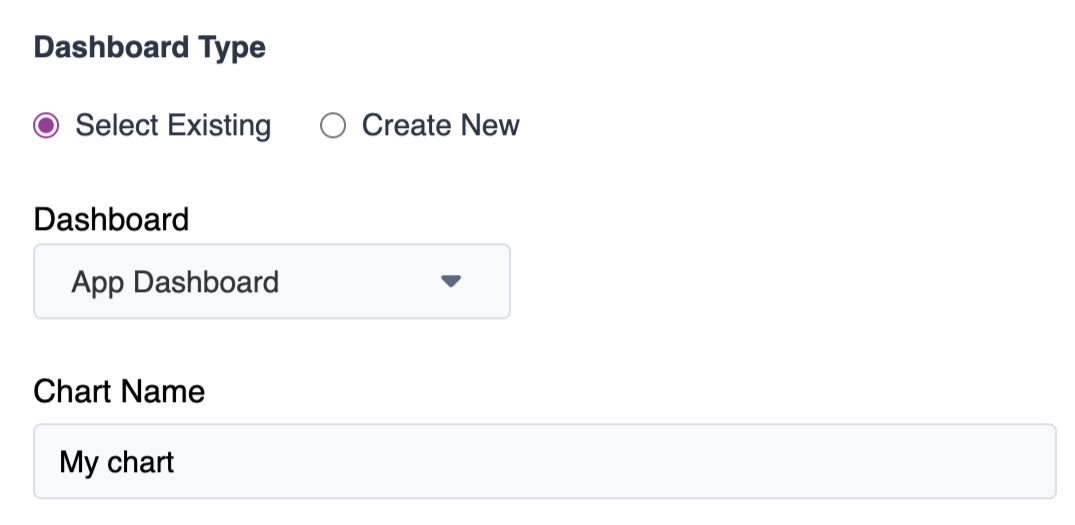
If you do not want to add your cohorts to your existing dashboards, or you do not have any existing dashboard, you can also create a new one.
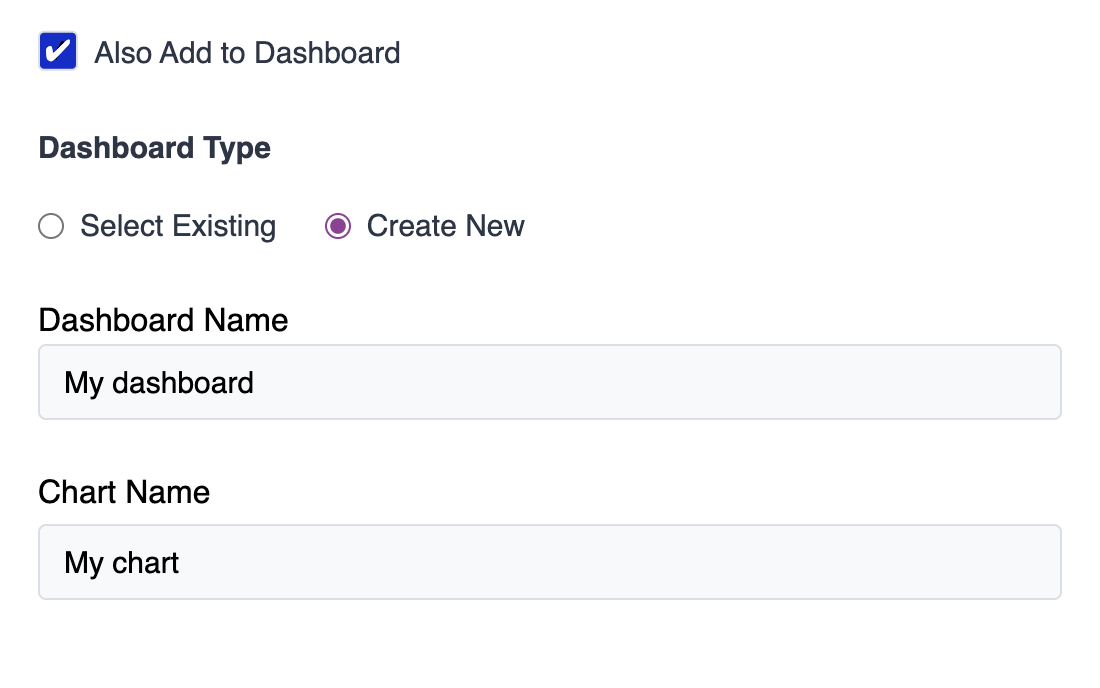
3. Type a chart name for your cohorts to appear with on the dashboard. You can have multiple charts under one dashboard.
4. Click the Add button on the bottom of the page to add your cohorts to the selected dashboard.
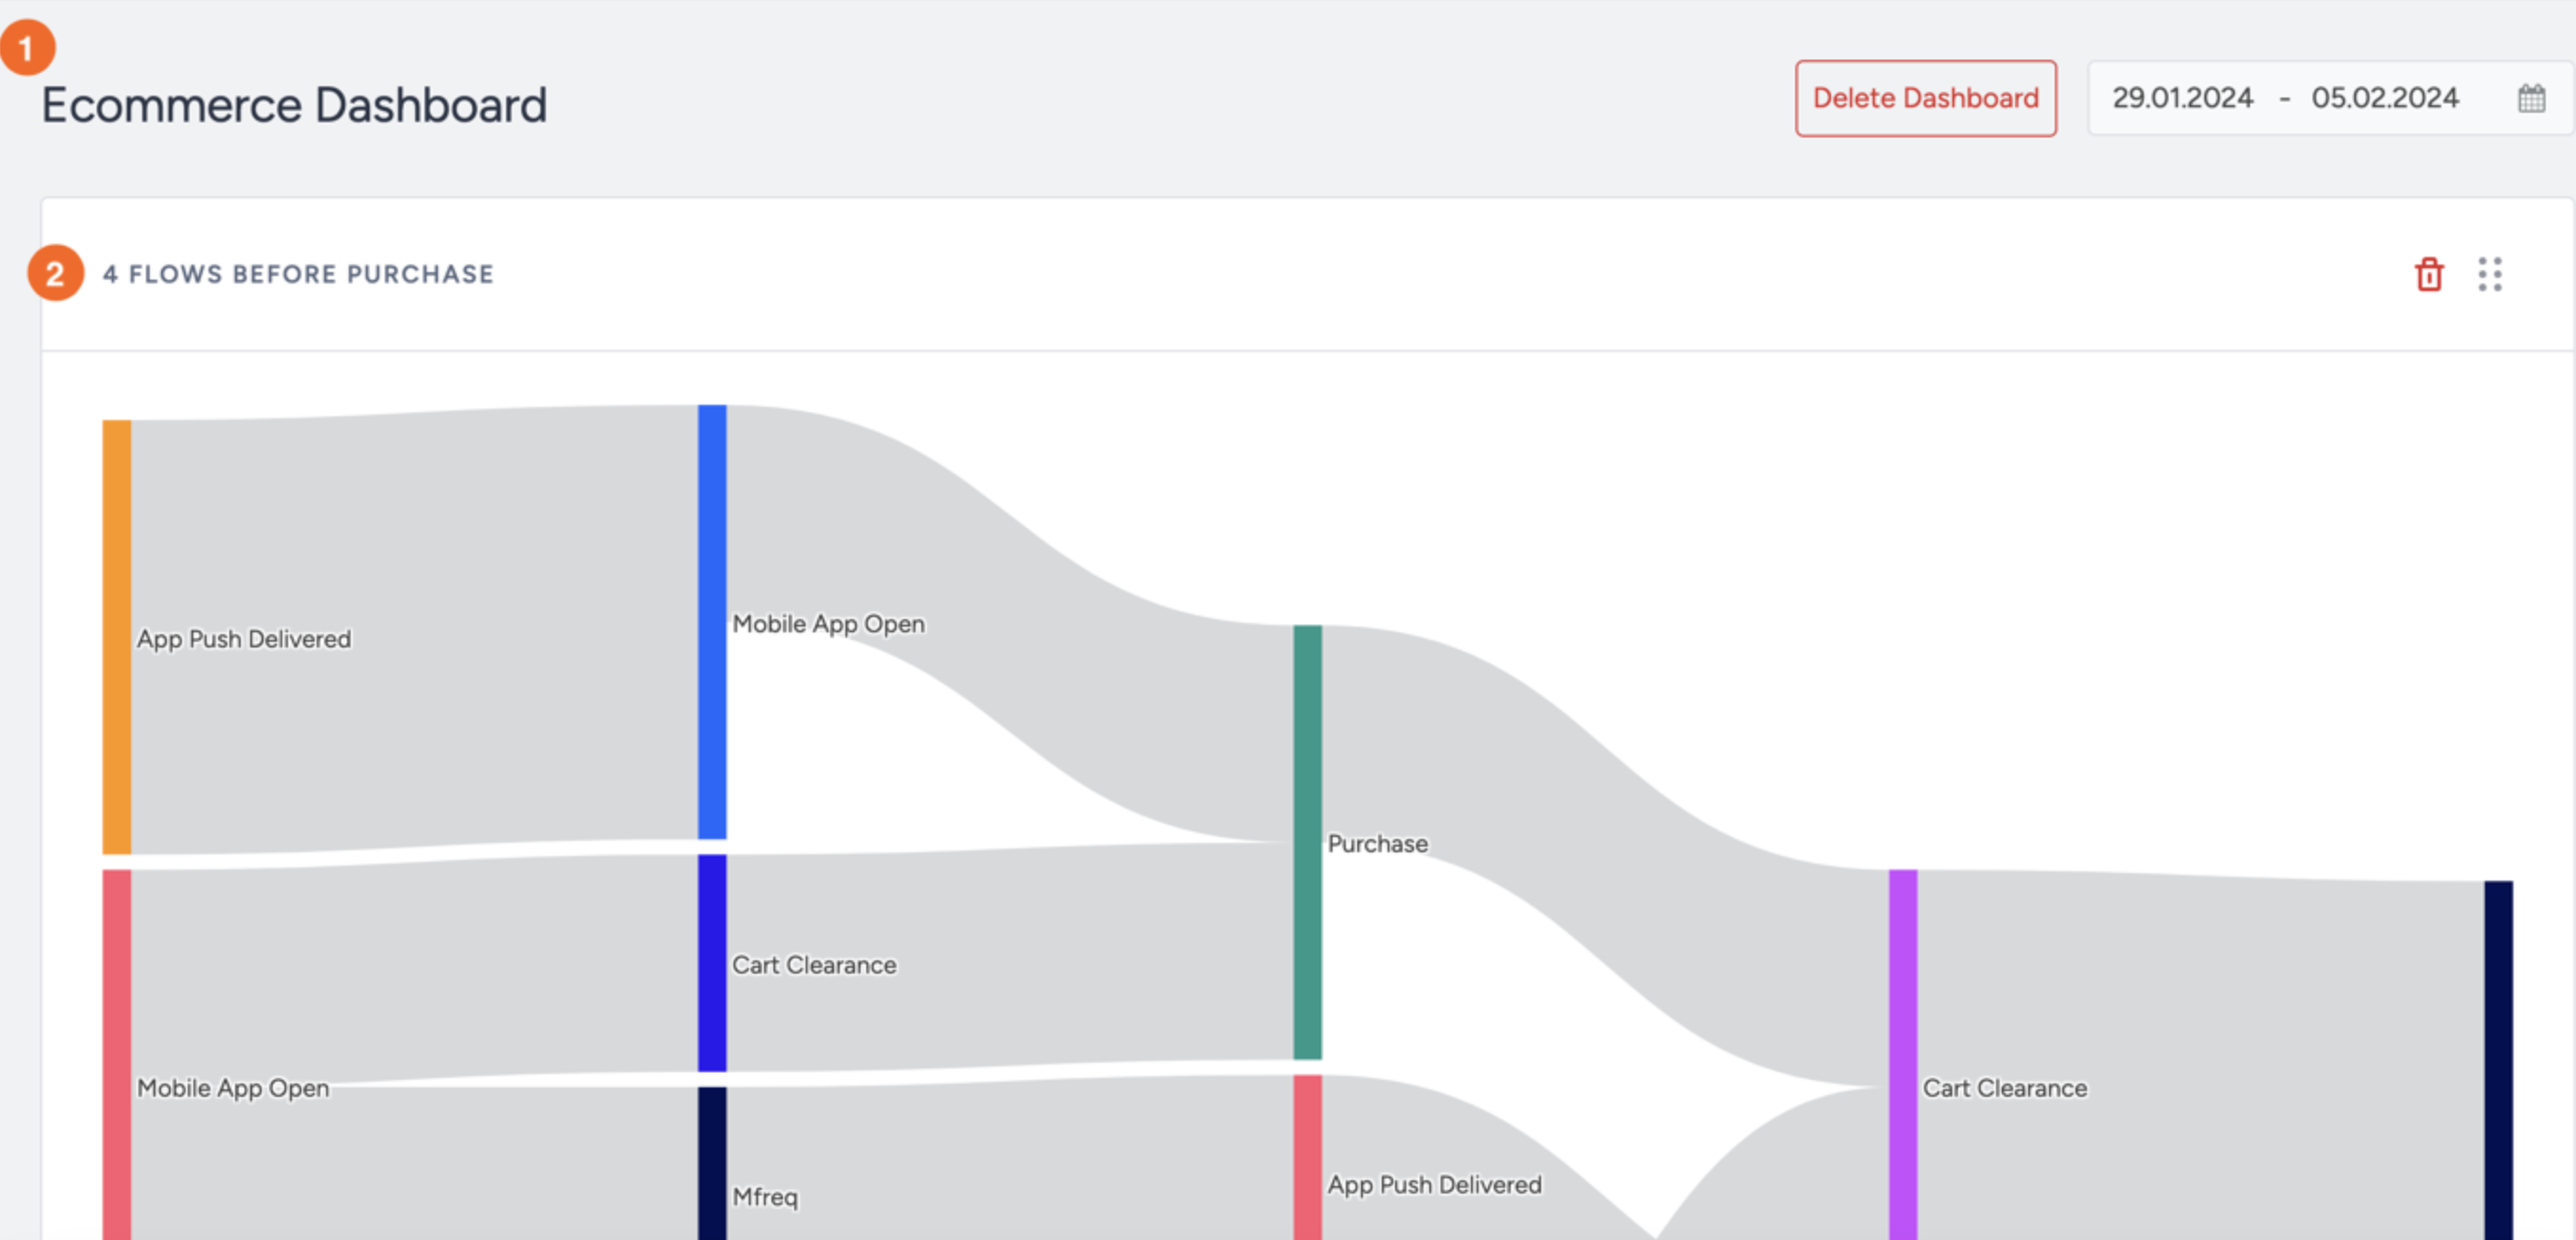
Once created, your dashboards will be listed under User Analytics > Custom Dashboards.

Was this article helpful?