User Analytics: Funnel Analytics
- 13 Mar 2024
- 8 Minutes to read
User Analytics: Funnel Analytics
- Updated on 13 Mar 2024
- 8 Minutes to read
Article Summary
Share feedback
Thanks for sharing your feedback!
A funnel is a visual representation of the steps that a user takes to complete a specific goal on a website or mobile application. It can help application owners understand where users are dropping off during the process, and identify potential problems that may be preventing them from completing the desired action.
Funnels are typically used in analytics tools to track conversions, such as the number of users who make a purchase or sign up for a newsletter. Application owners can analyze the data from a funnel, identify areas for improvement, and optimize their application to encourage users to complete the desired action.
With funnels, you can see which users have transitioned between the selected steps and which users have not.
You can use the funnels to follow the events across all channels such as web, application, API, etc, and understand in which scenario users stop using the module. You can see the number of successful users and drop offs from the first step to the next step in the sequential events.
This guide helps you:
Understanding the Funnel Chart
 The funnel chart consists of 3 sections: Completion rate, user count & drop off, and average time between steps.
On the top of the chart, you can see the completion rate of the funnel. This rate displays how many of your users who performed the selected event in the first step completed the last step.
The User Count displays the users who have completed the funnel while the Drop Off displays the users who have dropped off at that step in the funnel. You can also see the number of users in each group.
Below the chart, you can see the average amount of time it takes for users to complete the step transitions between the funnel steps you have selected. The display here is in Days, Hours, and Minutes.
Creating a Funnel
You can create a funnel with your events with the following options:
- Event selection
- Event parameters
- Date selection
- User filter
- Source selection
- Funnel options
Event Selection
To create a new funnel, you should select at least 2 events. The events you select in a funnel represent the steps that a user takes to complete a specific goal. With the selected events, you can define the path that users must follow to reach the end goal, and understand where they drop off the funnel.
Event selection allows you to tailor the funnel to your specific business goals, and track the performance of different user flows on your website or application.

Your title goes here
A funnel requires minimum 2 events. To add more, you can click the Add Funnel Step button.
You can also add multiple events in the funnel steps. Multiple events will have the OR function. This means that the respective funnel step will check the users who trigger the Event 1 OR Event 2 OR the other events if any.

Event Parameters (Optional)
Event parameter is a piece of additional information that is associated with an event. For example, if you have an event called "Purchase" that tracks whenever a user makes a purchase on your website, you could use event parameters to provide more details about the purchase such as the item that was purchased, the price, and the payment method. Event parameters can help you understand the context and details of an event, and make it easier to analyze and segment the data. For example, you could use event parameters to segment users based on the items they have purchased, or to compare the performance of different payment methods.
Your title goes here
Event parameters are not required to create a funnel. You can use them to elaborate the funnel steps.

Date Selection
In the context of a funnel, date selection refers to the ability to specify a date range for the data that is included in the funnel. This can be useful if you want to see how the funnel has performed over a specific period of time (e.g. in the past week or month).
You can select a date range to filter the data in the funnel to only include events that occurred within that time frame. This can help you understand trends and changes in the funnel over time, and make more informed decisions about how to improve its performance.
You can create your funnel for some special date ranges like yesterday, last month, or you can set a custom date range.
Source Selection
Your users may use your application on different sources. They may use it on the web, through a mobile application, or through an API. Source selection enables you to set your funnel for users from specific sources like app users, web users, API users.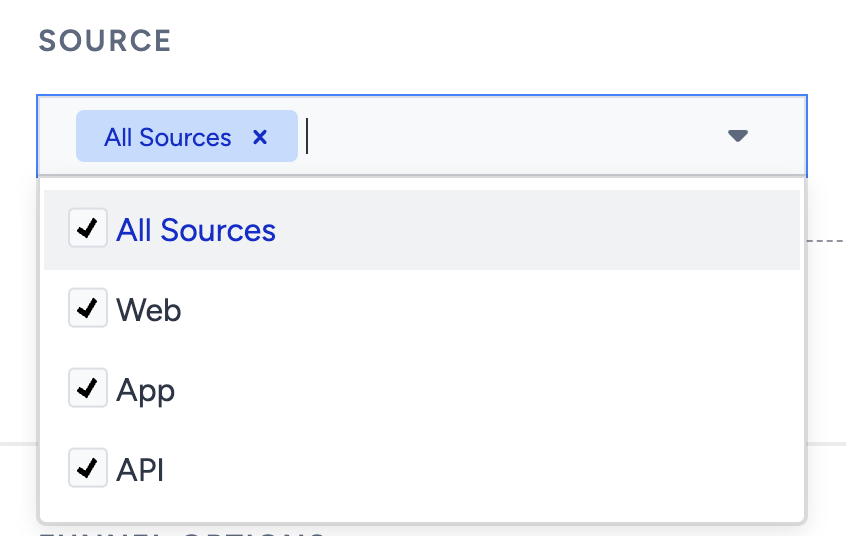
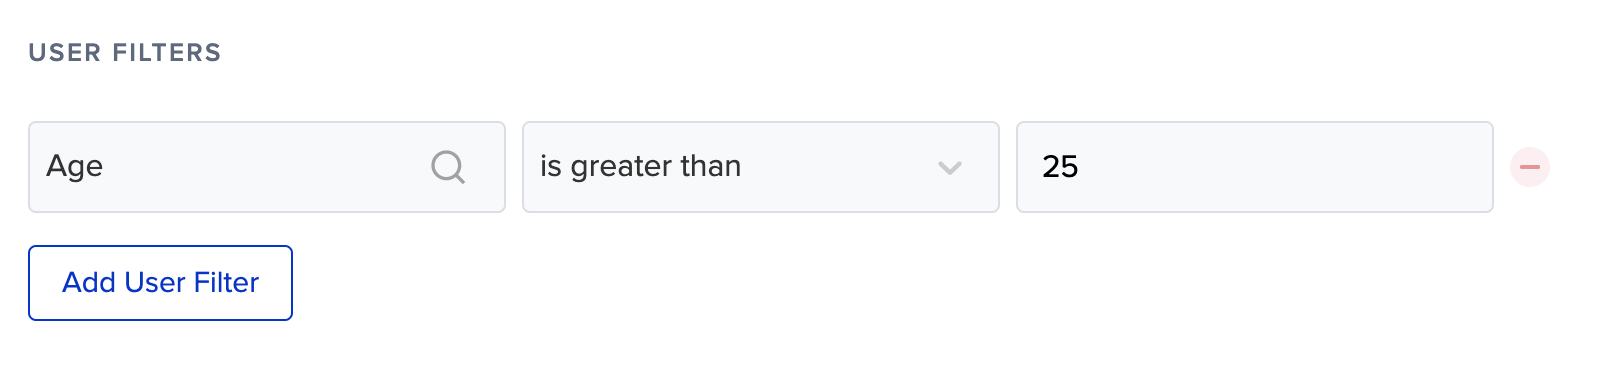
User Filters (Optional)
User filter is a way to limit the data that is included in the funnel to a specific group of users. This can be useful if you want to analyze the behavior of a specific subset of users (e.g. users from a particular location, users who have completed a specific action on your website or application, etc.).
You can apply a user filter to a funnel to see how this group of users is interacting with the funnel, and identify areas for improvement. User filters can help you understand the behavior of different user segments, and tailor your website or application to their needs. For example, you can detect the users who perform the event from the USA, users who use mobile, and users who are over 35 years old. Or you can use multiple user filters to apply the user filter to users who meet the two selected options. For example, this way you can see the users who live in the USA and are over the age of 35.
Additional Funnel Options (Optional)
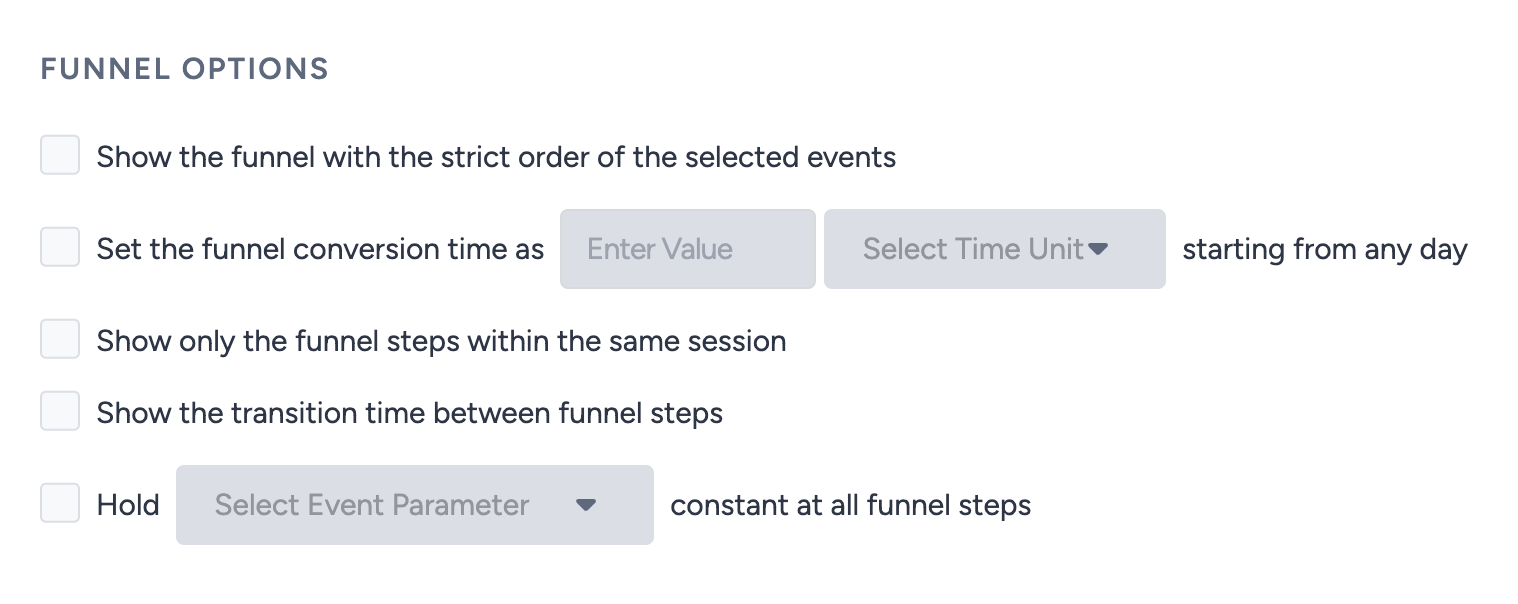
Show the funnel with the strict order of the selected events
This option helps make sure that the events will flow in a certain order of the funnel. Without this option, the funnel might also include some users who jump off from one step to other steps.
For example, you create a funnel with Homepage View in step 1 and Product Page View in step 2. A user triggers the homepage view event, proceeds to trigger another event such as registration page visit event, and afterwards triggers the product page view event. With this option off, this user will be considered for the second funnel step as they triggered the product page view event regardless of any other event in between. With this option on, the user will not be considered for the second funnel step as they proceeded to trigger another event between the homepage view and product page view events.
| Option | Funnel Step | Number of Users |
|---|---|---|
| Off | Homepage View | 1 User |
| Product Page View | 1 User | |
| On | Homepage View | 1 User |
| Product Page View | 0 User |
Set the funnel conversion time as N time unit
The funnel measures how long it takes for users to make transitions between the funnel steps in terms of average days, hours, minutes, or seconds. In other words, you can see how long it takes for users to move from the first event to the second event.
This conversion window represents the total elapsed time for the user to complete all the steps in the funnel (i.e. to convert). A shorter window typically leads to fewer users completing the funnel steps, while a longer window tends to result in more conversions.
Show only the funnel steps within the same session
This option helps you analyze funnels with the user actions that are associated with the same session.
For example, if you create a funnel with Homepage View and Product Page View events respectively, a user who triggers the Homepage View event today and the Product Page View event tomorrow will be counted in the funnel with this option off. If you enable this option, they will not be in the second step of the funnel as this option requires the events to be triggered within the same session.
This option will always be on while the "transition time between funnel steps" is on.
Show the transition time between funnel steps
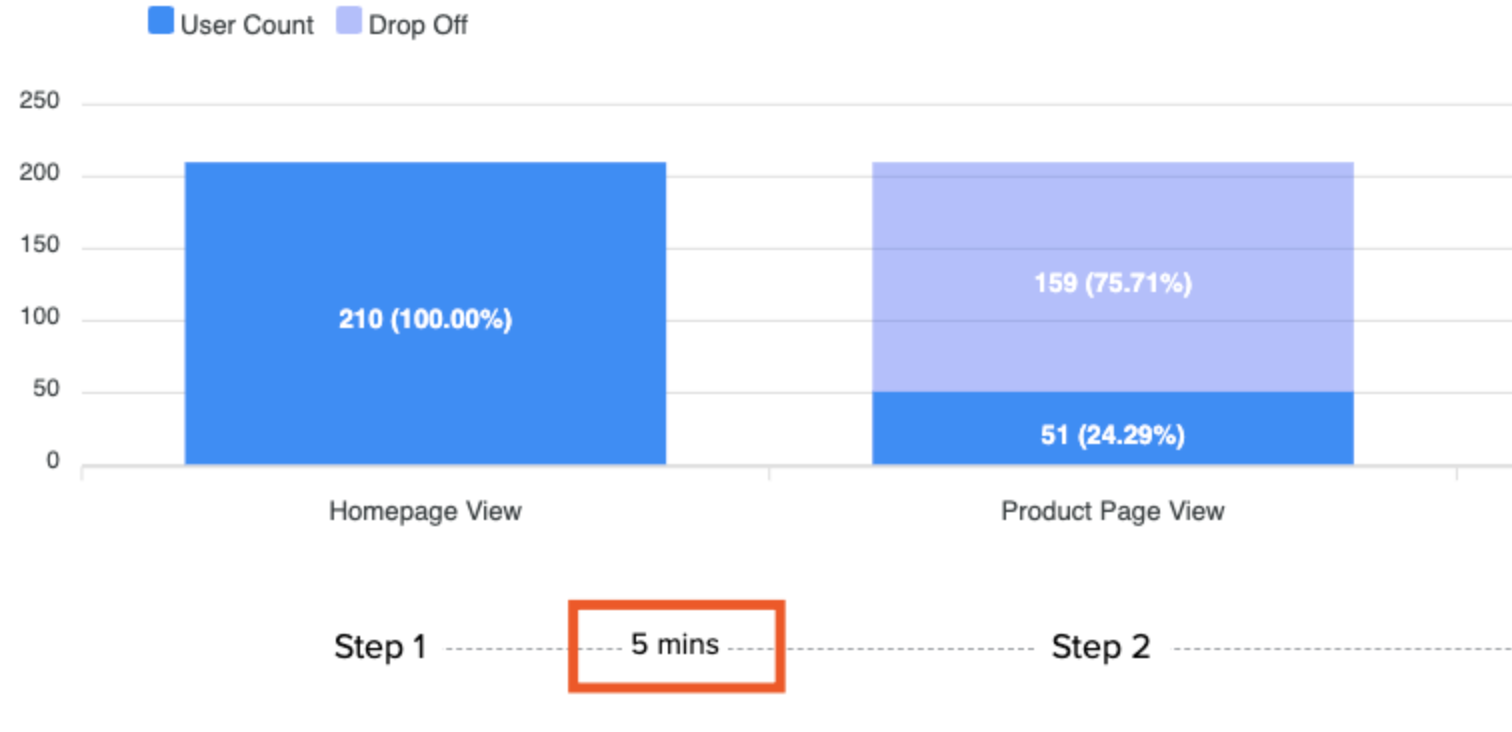
This option displays the average time it takes users flow from step 1 to the next step(s).
Hold event parameters constant in all funnel steps
Event parameter is associated with an event. With this option on, the respective event parameters are applied to all occurrences in the following steps. For example, if you hold the Brand event parameter constant for your event, only the steps with the event actions (e.g. purchase) of the specified brand are considered as successful conversions. If a user buys from another brand, it will not be counted in the funnel.
Saving a Funnel
You can save your funnels to quickly access and use them in the future. A saved funnel includes the event and event parameters that are included in the funnel, as well as any filters or other settings that have been applied to the funnel.
Once you save a funnel, you do not need to reconfigure it each time. This can be useful if you want to regularly track the performance of a specific funnel or if you have multiple teams that need to access the same funnel.
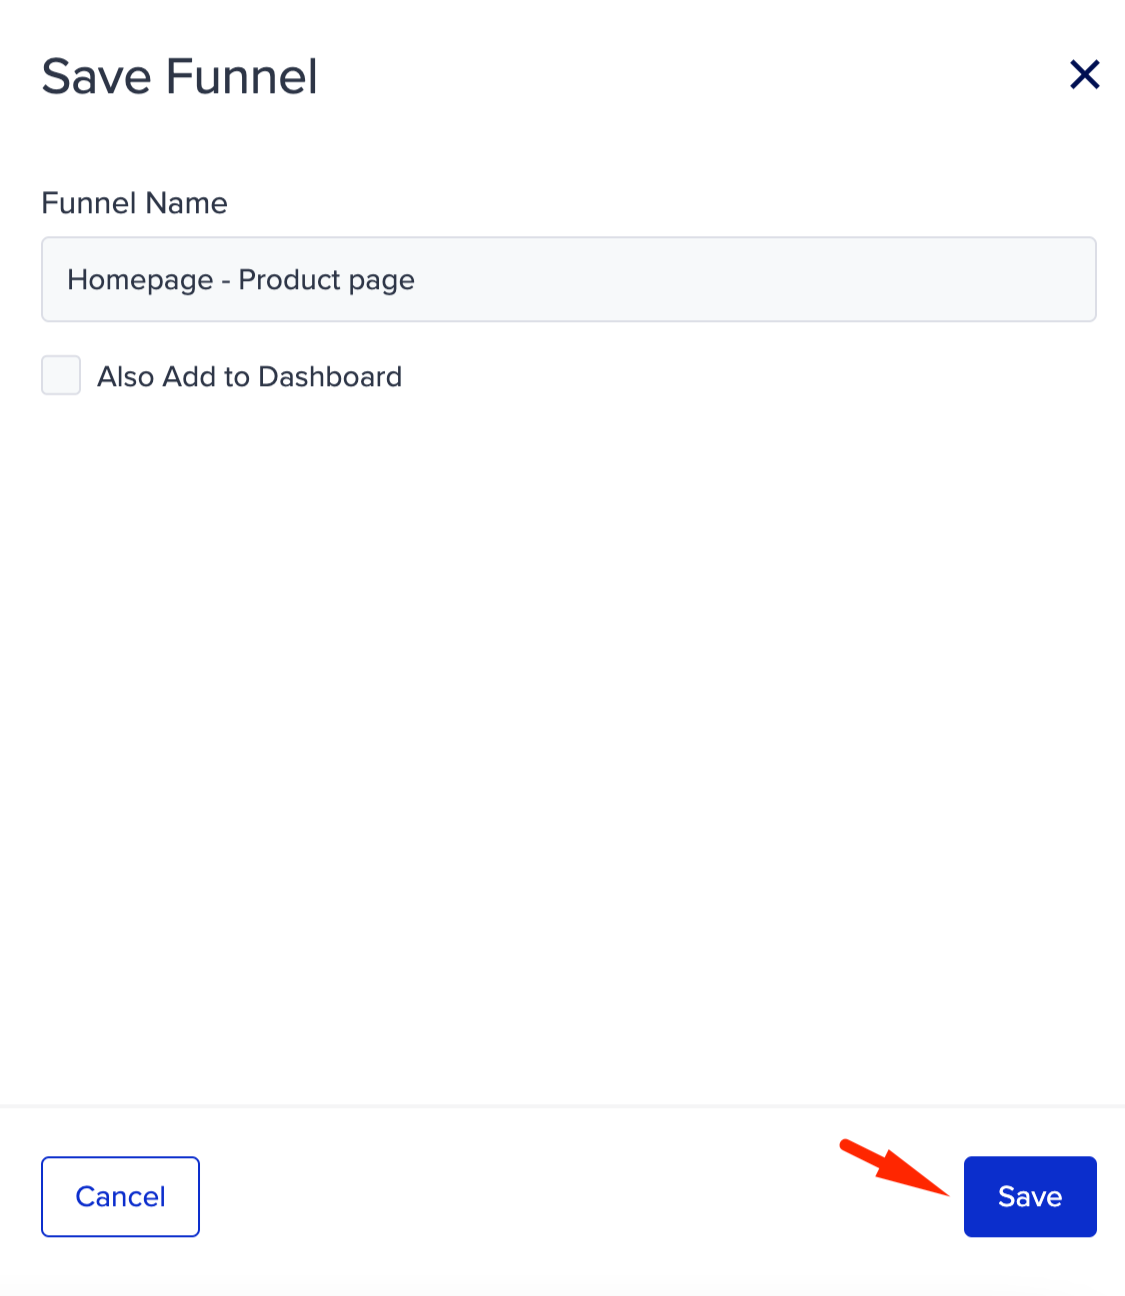
Once you click the Save button, you can save all the input you have entered for the funnel, and access it later among the previously saved funnels. This can be useful if you want to keep track of different funnel configurations or if you want to use the same funnel setup for multiple analysis tasks.
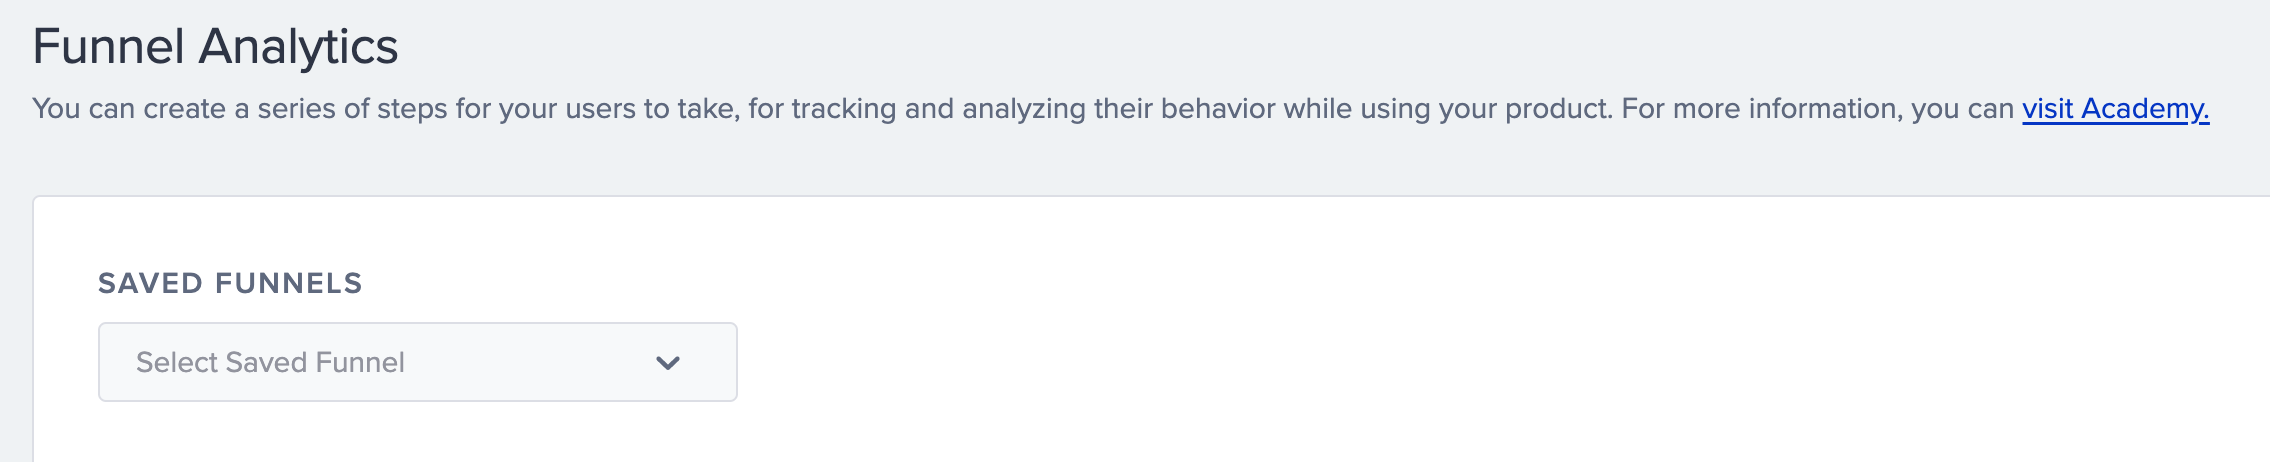
When you select a saved funnel from the dropdown, all the input for that funnel will be automatically filled in the appropriate fields. This can save you time and effort if you want to use a previously saved funnel for your analysis.
Add to Dashboard
While saving your funnel, you can also add this funnel to an existing dashboard or create a new dashboard to add it.
1. Check the "Also Add to Dashboard" box.
2. Choose from: Select Existing or Create New to save your funnel to.
Select Existing displays the existing custom dashboards you can select from.

If you do not want to add this flow to your existing dashboards, or you do not have any existing dashboard, you can also create a new one.
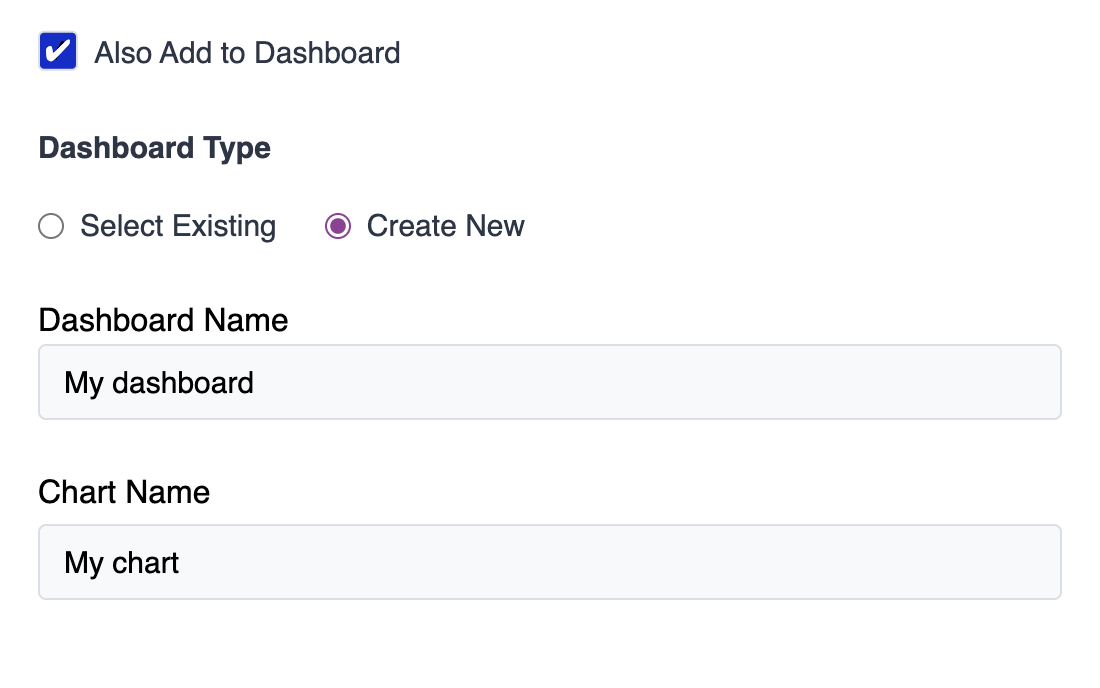
3. Type a chart name for your funnel to appear with on the dashboard. You can have multiple charts under one dashboard.
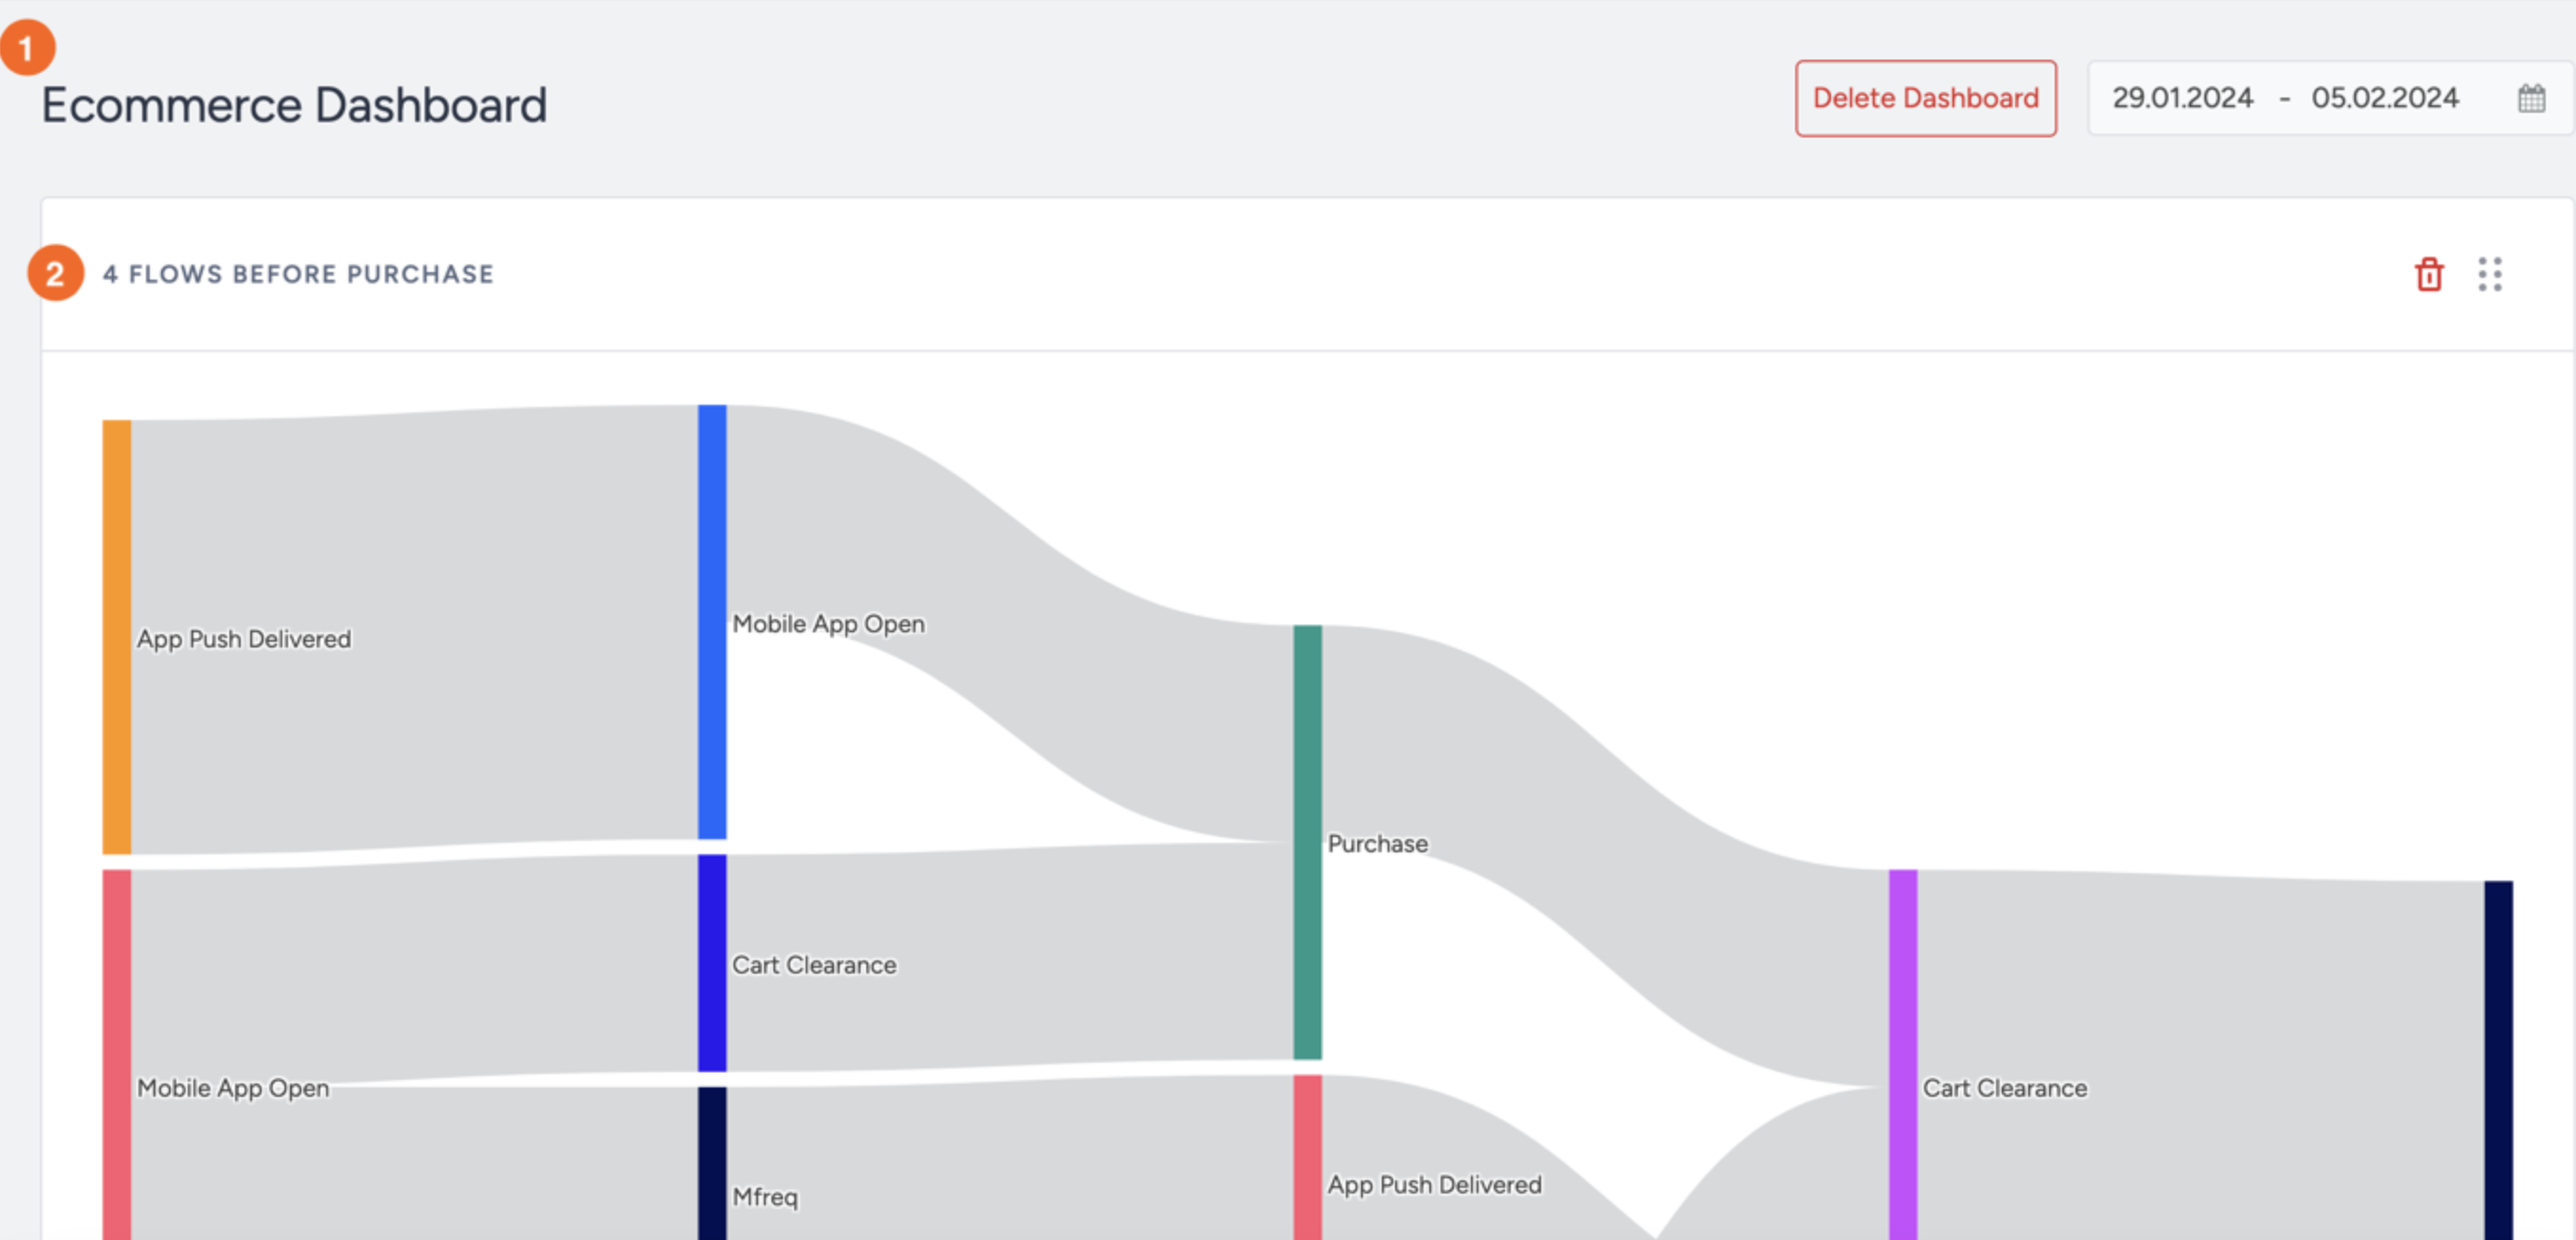
4. Click the Save button on the bottom of the page to save your funnel, and add it to a dashboard.
Once created, your dashboards will be listed under User Analytics > Custom Dashboards.
.png)
Was this article helpful?