User Analytics: Flow Analytics
- 13 Mar 2024
- 3 Minutes to read
User Analytics: Flow Analytics
- Updated on 13 Mar 2024
- 3 Minutes to read
Article Summary
Share feedback
Thanks for sharing your feedback!
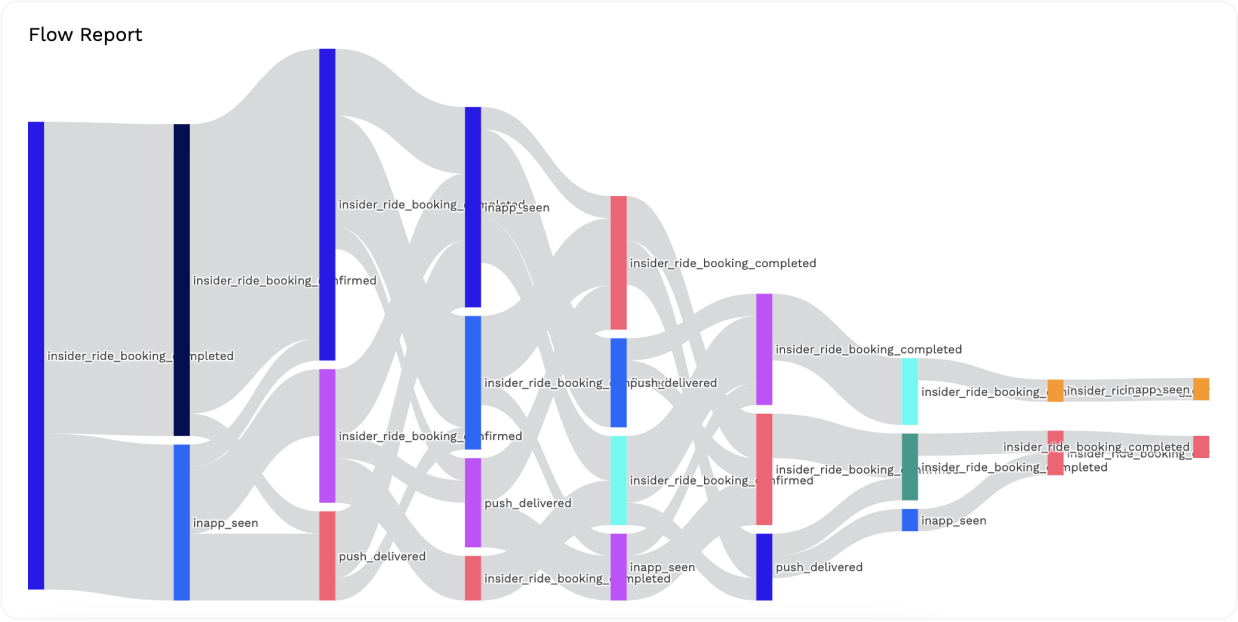
Flows show the popular paths that users take on your platform within the selected period of time. The purpose of the Flow is to display collective user flows in the selected event across all channels such as web, application, API, etc.
Flow Analytics can help you with the following use cases:
- See the details based on user type (also know as segments) to define bottlenecks, and target them with the right personalization at the right moment.
- Get insights about users and their interactions on the feature/page level to understand the potential improvement areas and run A/B tests to optimize their experience.
You can create a specific path, change the time range of the flow, or add filters and parameters.
Flows help you analyze the user journey to identify trends and patterns. With user flow, you can get a better understanding of your users and use that knowledge to improve the user experience. In short, you can analyze the steps that your users take before or after an event you select.
You can set up an event to analyze the outgoing (flows with events that happen after the selected event) or incoming (flows with events that before the selected event) flows with the base step. You can set the number of steps you want to see for the selected event in your flow.
Creating a Flow
To create a flow,
1. You should first select the Event you want to analyze. You can also add event parameters for the selected event.
2. Then, you should identify the Base Step, which aims to create a flow for the selected event such as creating a flow starting with this event or creating streams ending with this event.
- You can choose First Step to make the event the starting point of checking your user flow. For instance, selecting 'Homepage' will reveal the subsequent actions (events) users take after visiting the homepage.
- You can choose Last Step to make the event the ending point of checking your user flow. For example, selecting 'Purchase' as the last step enables you to examine the preceding actions (events) users take before making a purchase. This insight empowers you to focus efforts on enhancing those activities further.
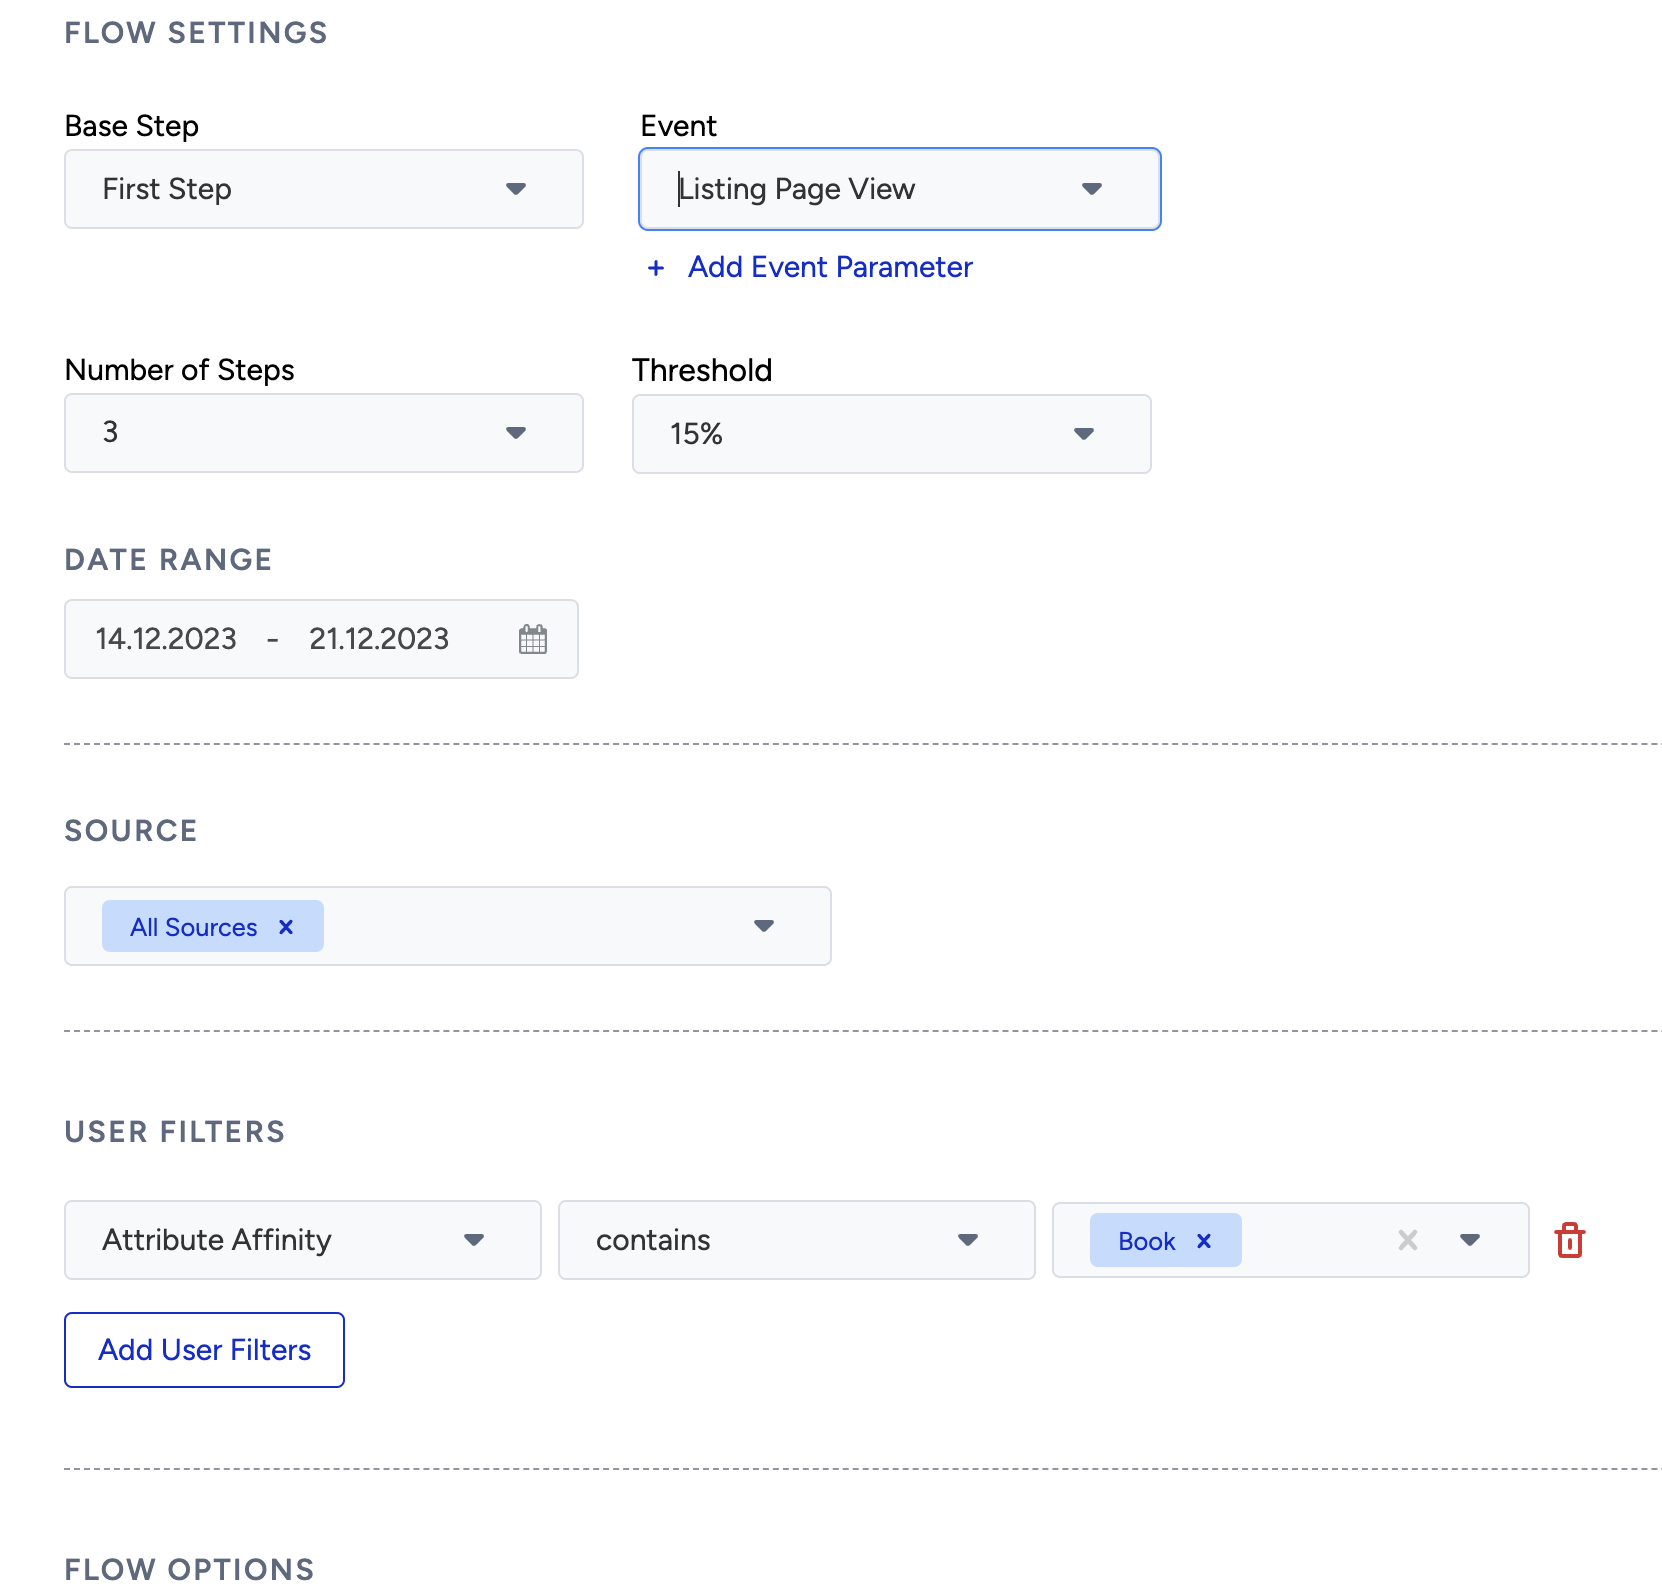
3. After the event selection, you should specify the number of steps for flow. It indicates the number of stages you want to display after the Base Steps. However, it's important to note that certain visuals may be limited when dealing with a high number of steps. For example, if you choose 3 as the maximum rank, your flow will be created for 3 steps before or 3 steps after the selected event.
.png)
4. A Threshold serves as a minimum allocation level calculated for each step in the determination process. To elaborate, let's take an example: if you have 100 users progressing from the first step to the second step.
- When you set the threshold at 5%, it implies that the next step will encompass events where 95% of your users are distributed.
- In essence, the lower you set the threshold, the more events you will observe.
- The events are ordered from the most distributed to the least. Subsequently, the system filters the events where the top 95% of users are distributed.
5. To create a flow, you should also select a date range.
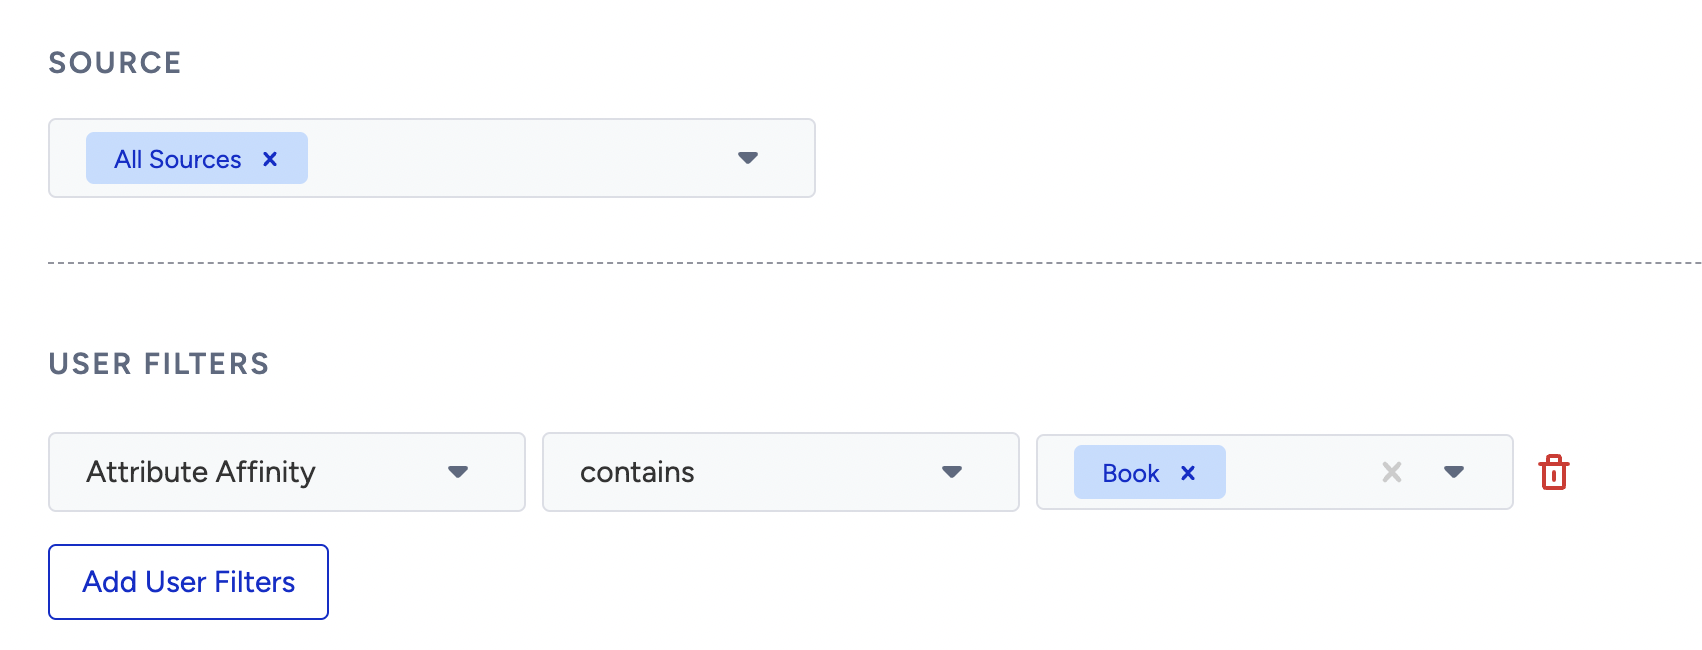
6. You can also adjust your flow for different data sources with source selection. Additionally, you can set your flow for different user segments with user filters.
Adding Your Flow to a Dashboard
Before or after generating your flow, you can also add it to an existing dashboard, or create a new one to add it.
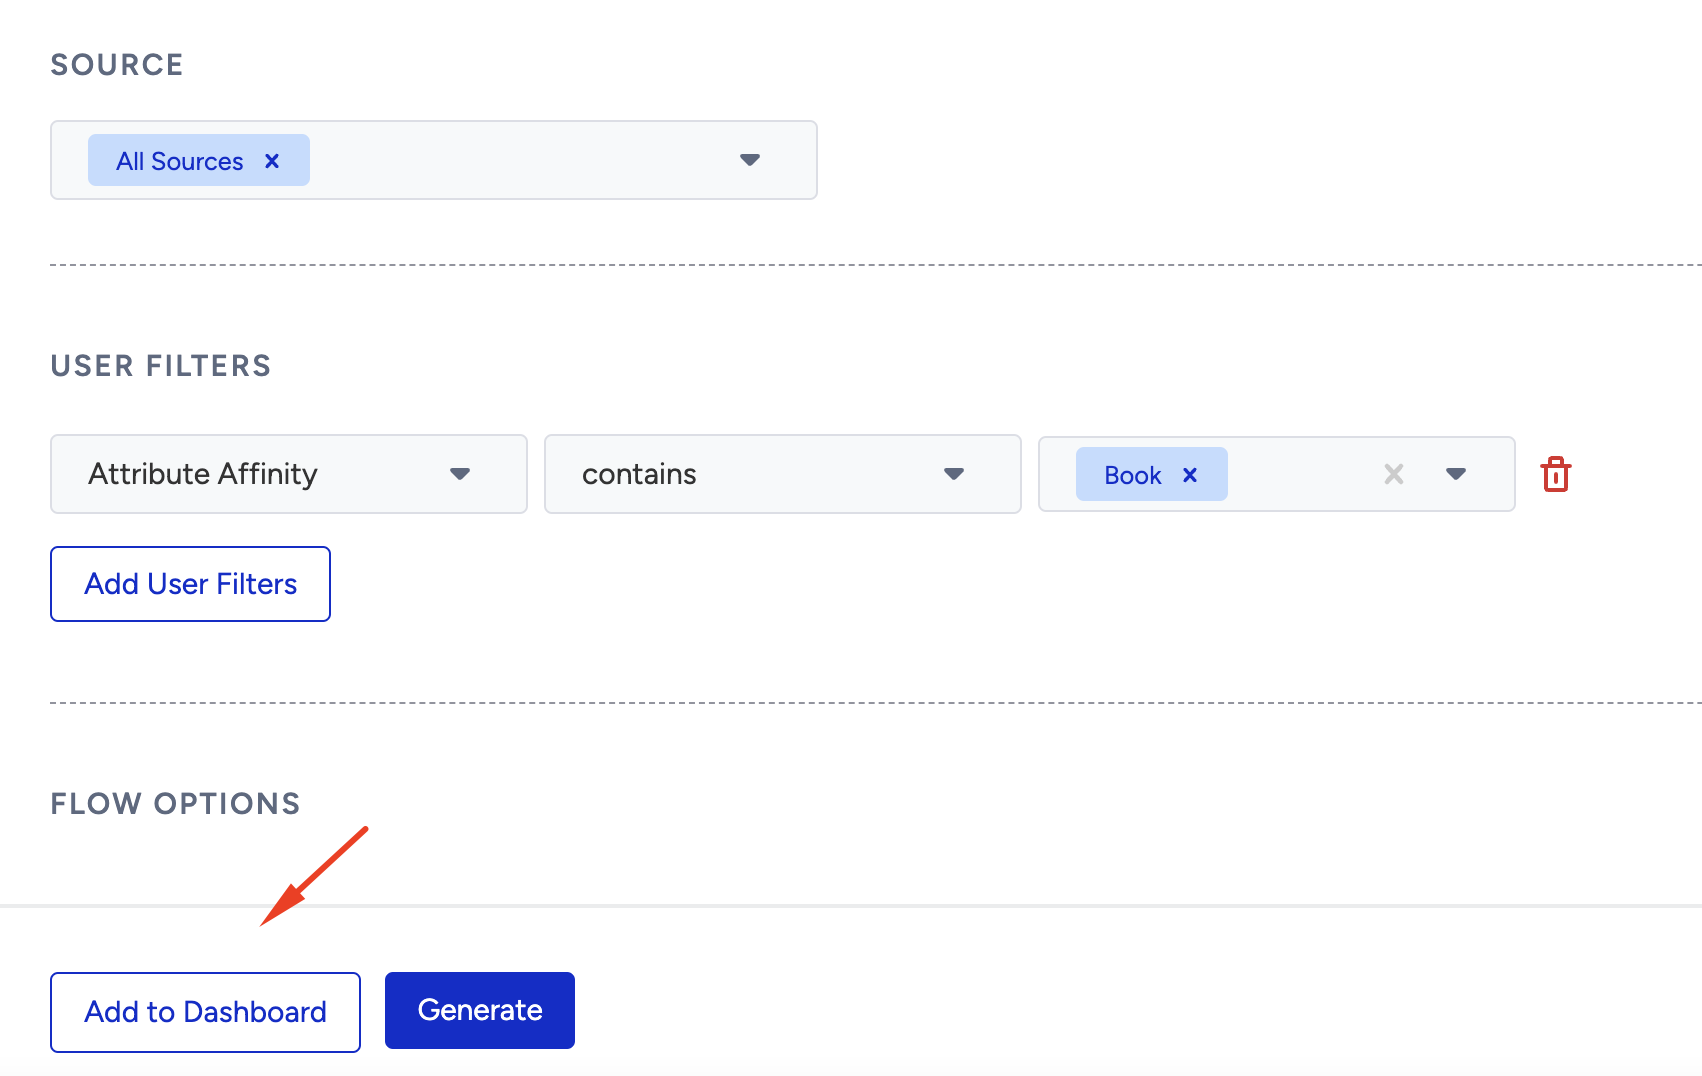
1. Click the Add to Dashboard button. A window will appear in the right hand side of the screen.
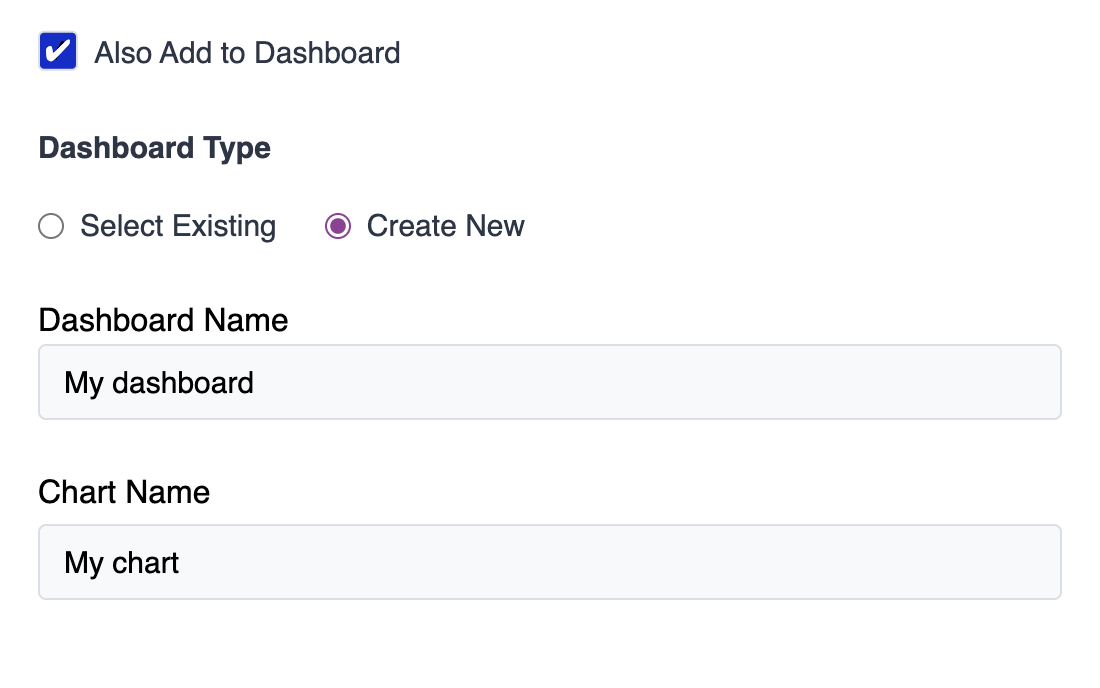
2. Choose dashboard from: Select Existing or Create New to add your flow to.
Select Existing displays the existing custom dashboards you can select from.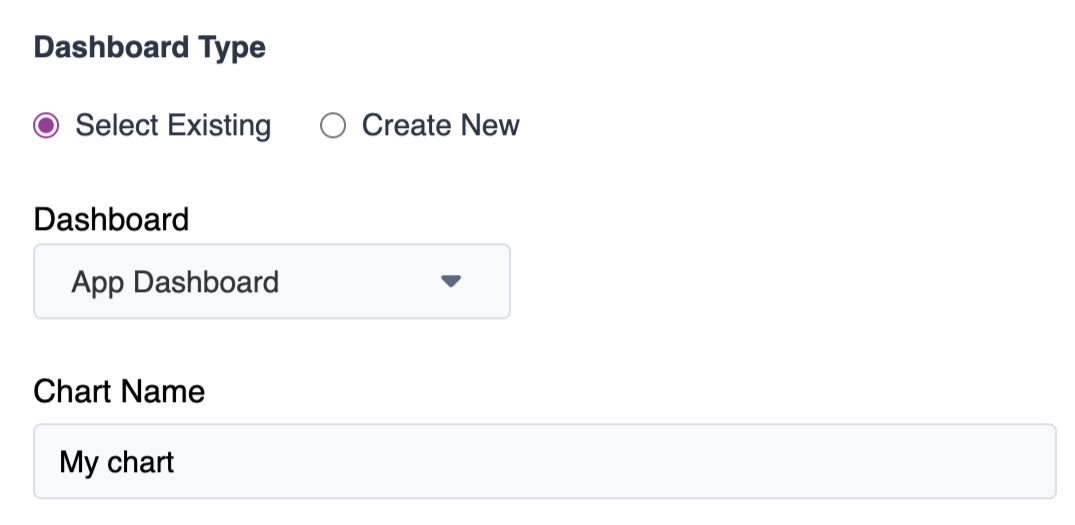
If you do not want to add this flow to your existing dashboards, or you do not have any existing dashboard, you can also create a new one.
3. Type a chart name for your flow to appear with on the dashboard. You can have multiple charts under one dashboard.
4. Click the Add button on the bottom of the page to add your flow to the selected dashboard.
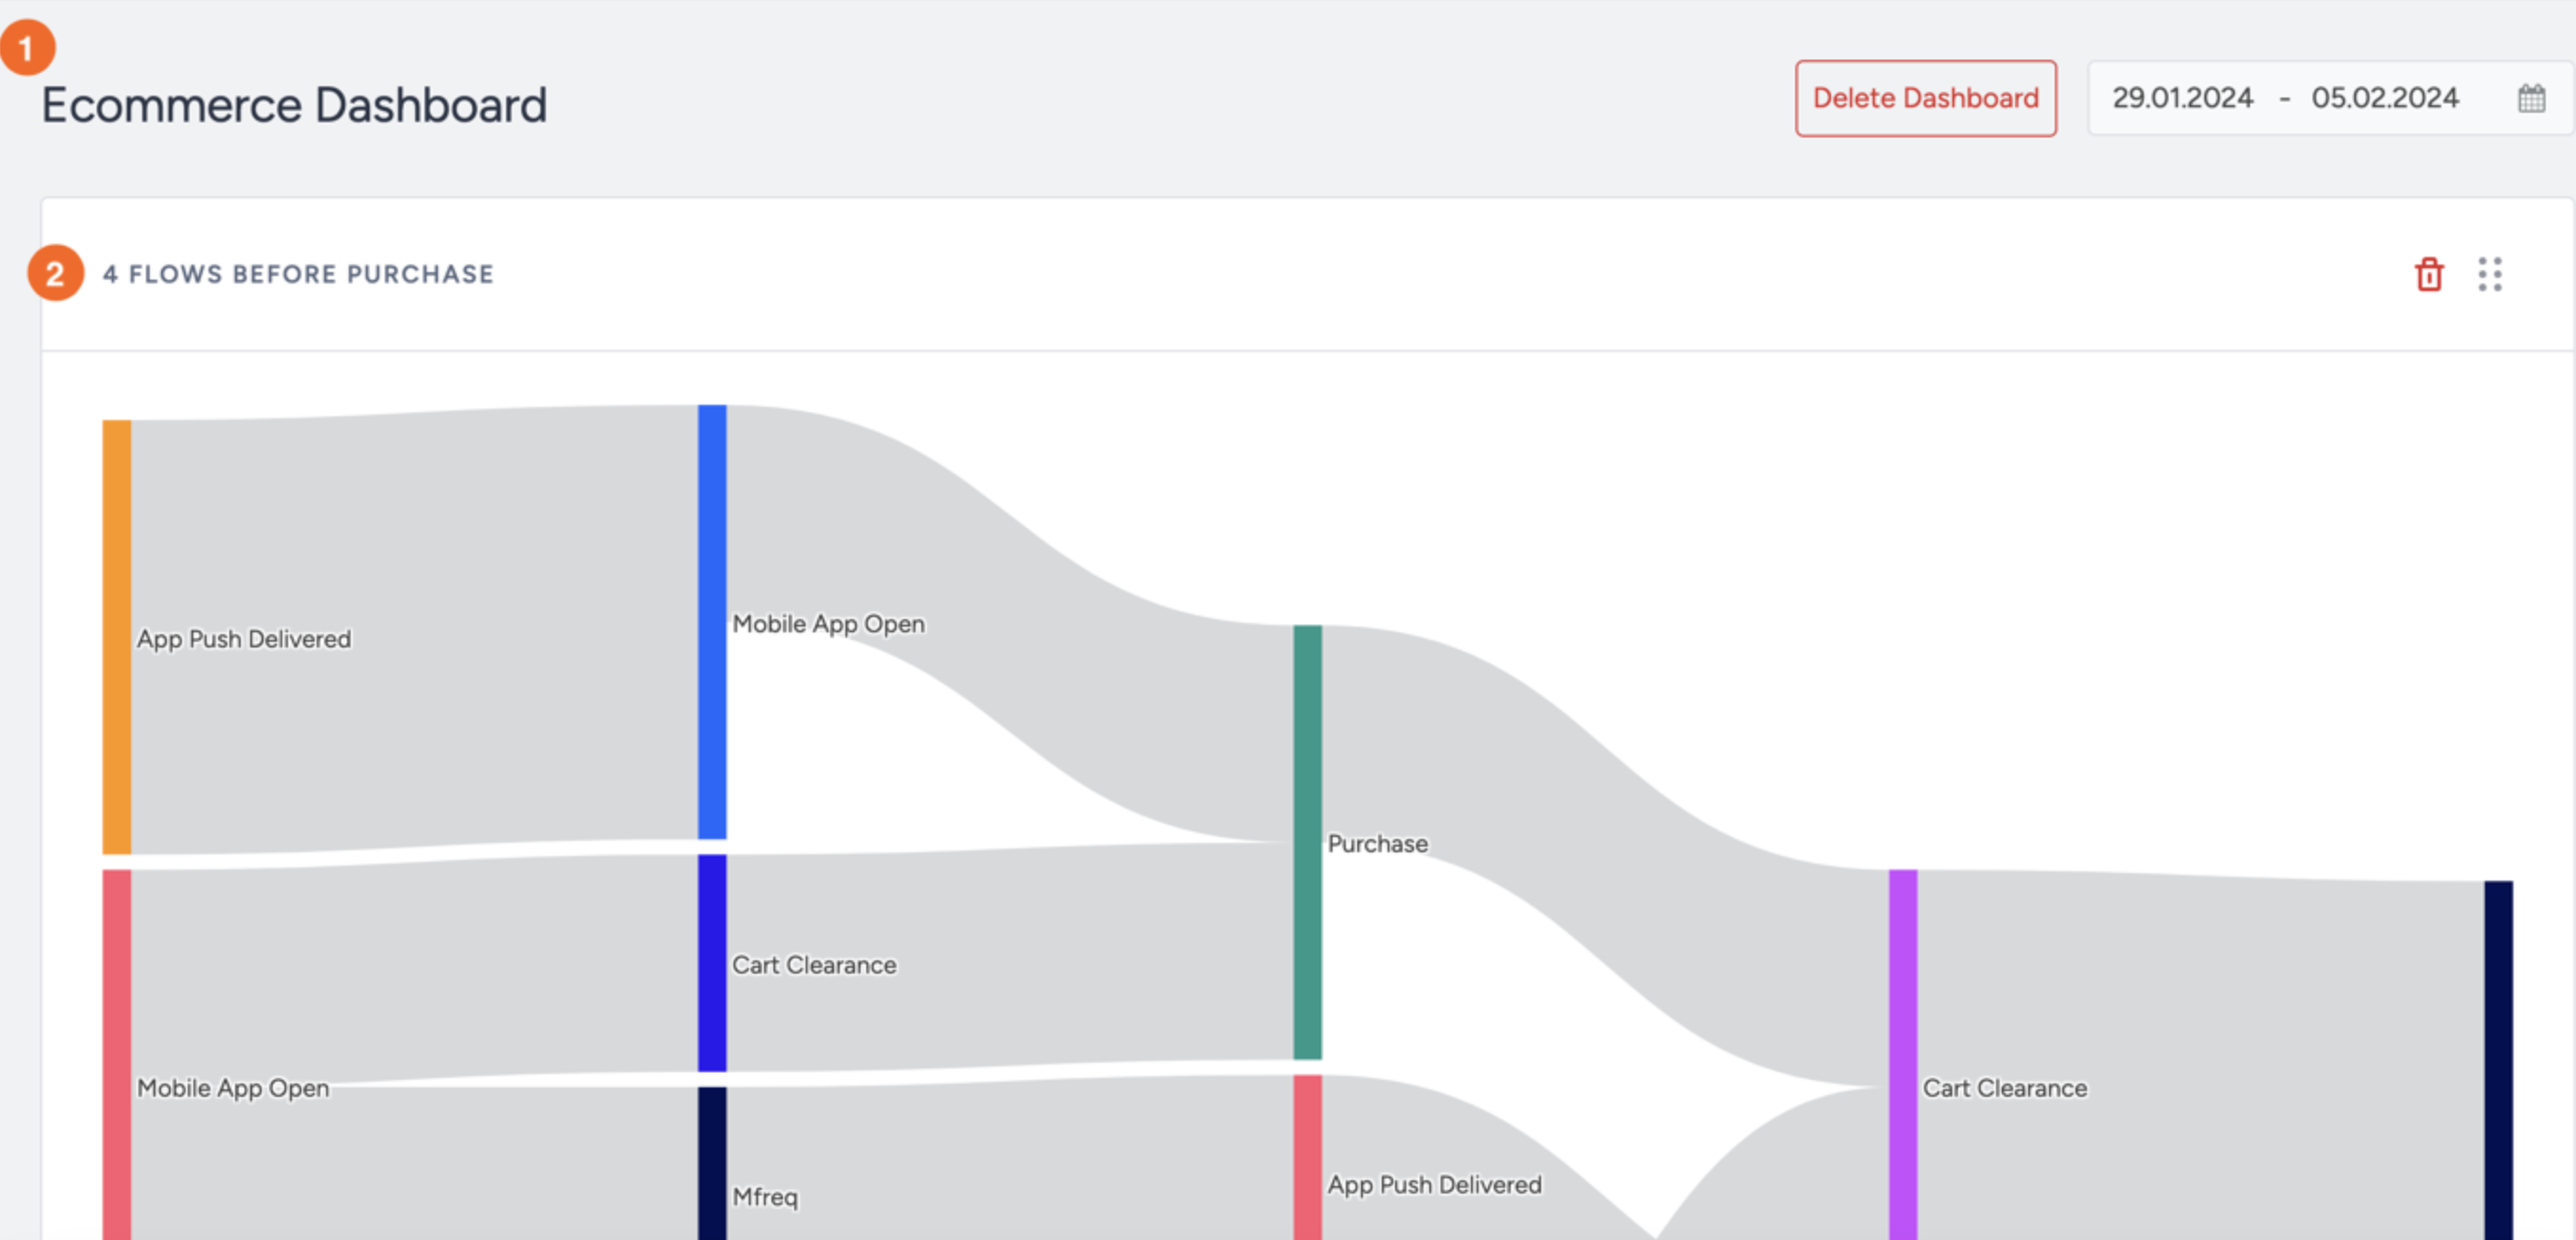
Once created, your dashboards will be listed under User Analytics > Custom Dashboards.
.png)
Was this article helpful?