Web Push Subscriber Analytics
- 28 Mar 2024
- 2 Minutes to read
Web Push Subscriber Analytics
- Updated on 28 Mar 2024
- 2 Minutes to read
Article Summary
Share feedback
Thanks for sharing your feedback!
To access Web Push Opt-in Analytics, navigate through Reports > Web Push Analytics > Web Push Subscriber Analytics.

Understanding the report
In the selected date range, you can observe the number of the total subscribers, new subscribers, unsubscribers and net subscribers growth. You can view it on daily, weekly or monthly basis.

Applying filters
You can filter the report using the following four parameters: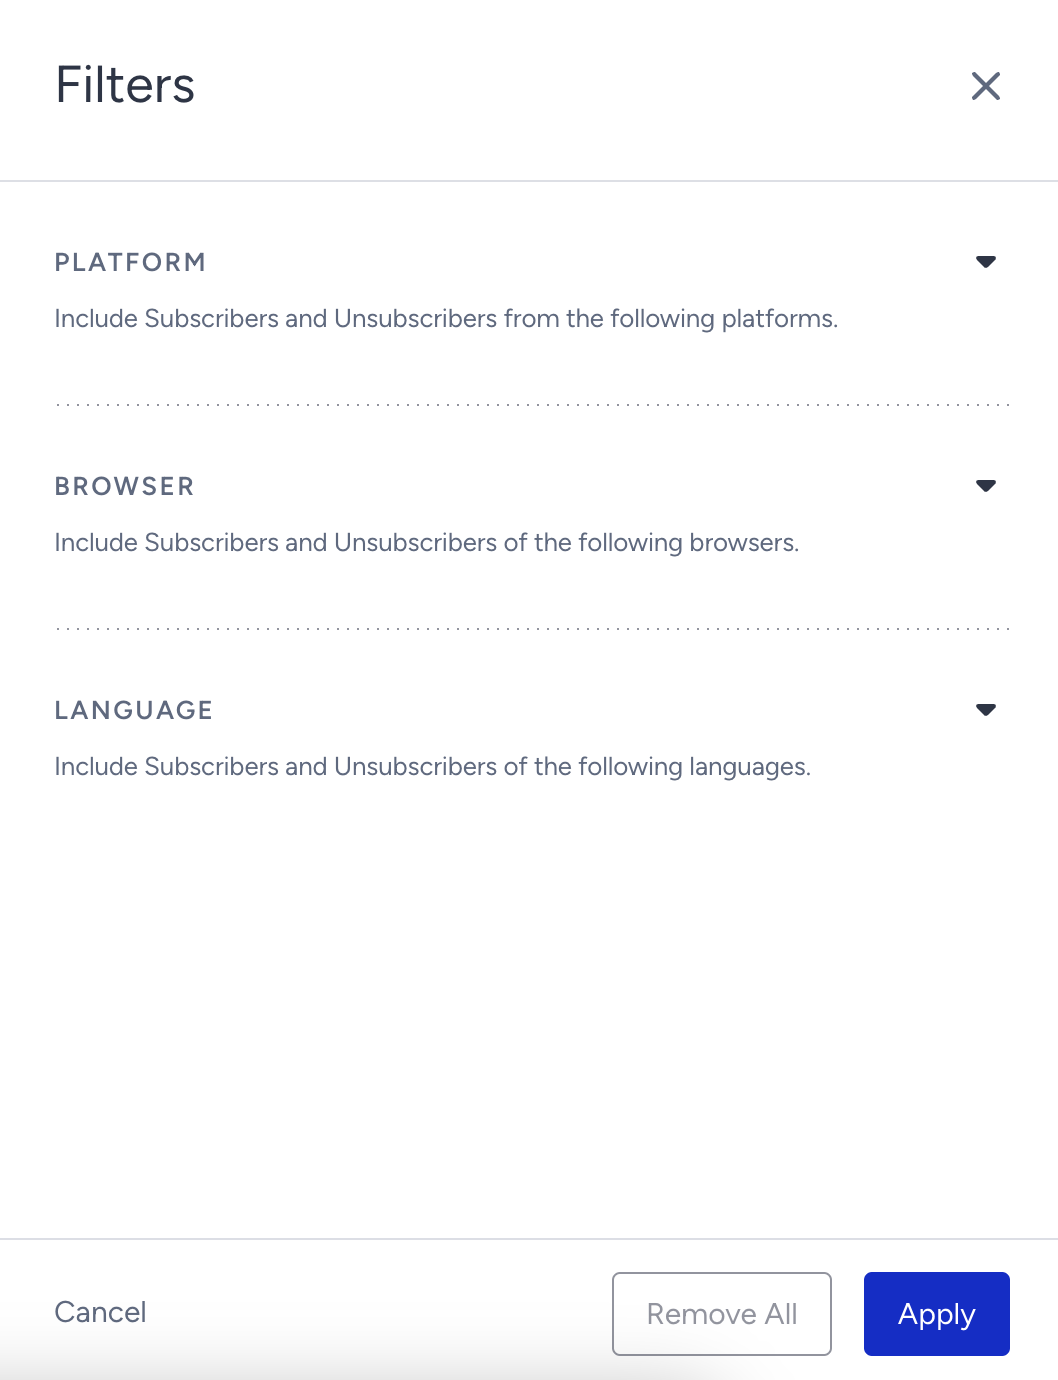
- Platform: Select desktop or mobile, or all.
- Browser: Select Chrome, Safari, Firefox, Yandex, Opera, Yandex or Samsung Internet.
- Language: Select the language in which you collect the opt-in.
You can also use the date picker to filter your results.
Overall Subscriber Analytics

- Total Subscribers: Total number of users who have opted-in to web push on your website. This is independent of the date range selected on the report.
- Total Engaged Subscribers: Total number of the users who have visited your website or who have at least one web push click, view or close action in the last 6 months.
- New Subscribers: Total number of users who have opted in for your Web Push messages in the selected date range.
- Unsubscribers: Total number of users who have opted out from your Web Push messages in the selected date range.
- Net Subscriber Growth:Net increase in your total number of users who have opted in for your Web Push messages in the selected date range.
Your title goes here
Total Subscribers and Total Engaged Subscribers metrics are independent of the date range selected on the report.
Unsubscribers
Under Unsubscribers, you can analyze the reasons for users who opted out.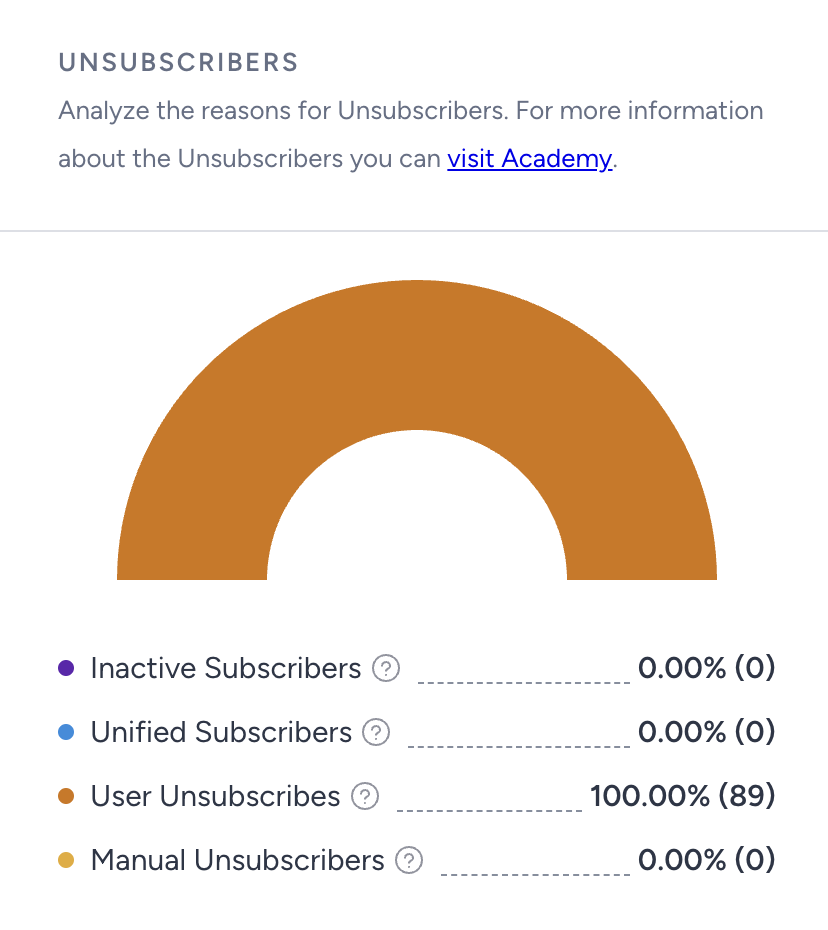
- Inactive Subscribers: Percentage and the number of your subscribers who were removed due to not visiting your website in the last 365 days.
- Unified Subscribers: Percentage and the number of your subscribers who were removed due to the same user data found and merged into a single user ID.
- User Unsubscribers: Percentage and the number of your subscribers who opted out from your Web Push messages.
- Manual Unsubscribers: Percentage and the number of your subscribers who were removed manually and via API.
Subscriber Insights
Under Subscriber Insights, you can visualize the daily, weekly and monthly trend of how subscribers have been subscribing to receive push notifications from your website.

Opt-in Prompt Insights
This section shows the performance of your opt-in screens. Since you might have different opt-in types enabled at different times as it is possible to migrate between these two types, you can observe both native and custom opt-in data in this table: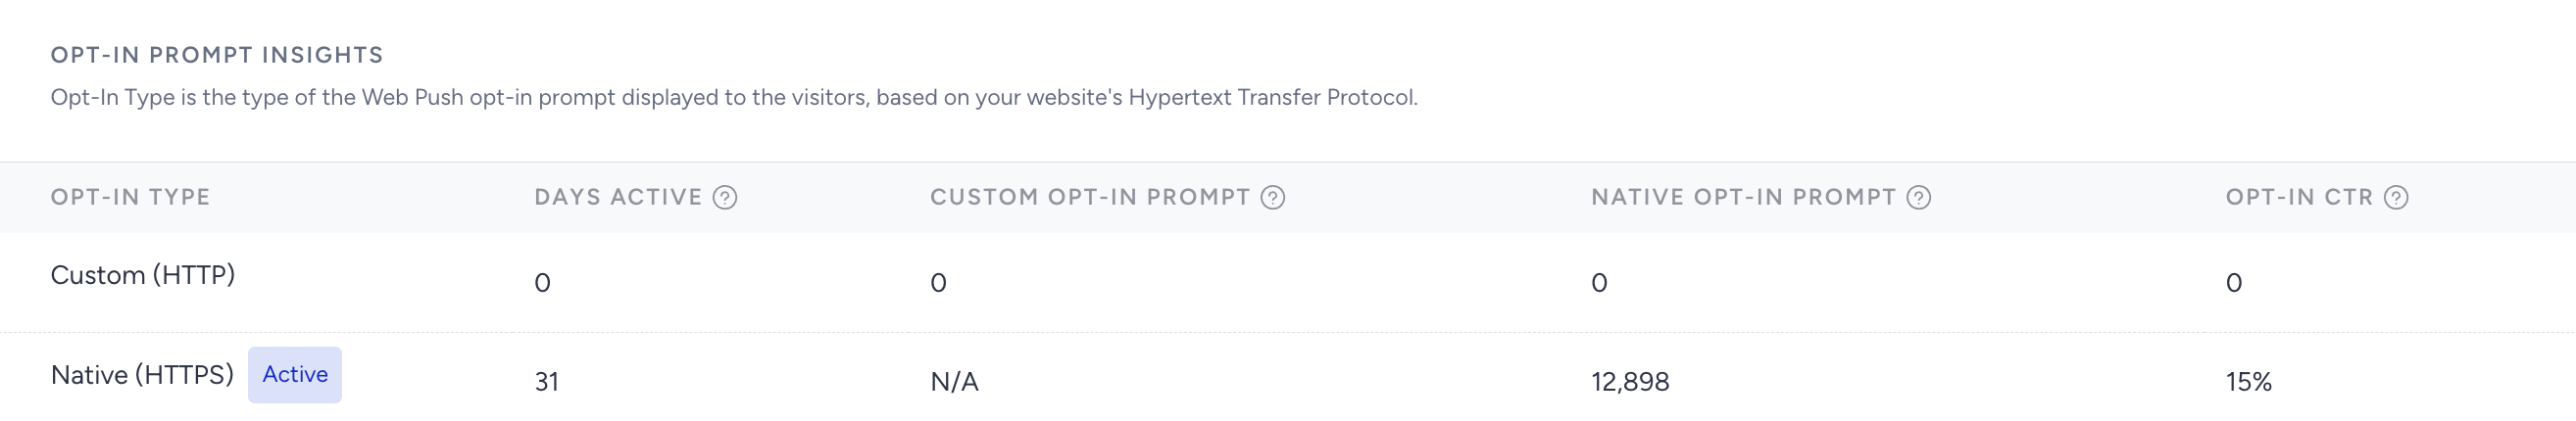
- Days Active: Number of days for which the opt-in screen was active in the selected date range
- Custom Opt-in Prompt: Number of times the first permission screen for custom opt-in was shown. For native opt-in, this screen is not displayed.
- Native Opt-in Prompt: Number of times the browser's own opt-in prompt was shown. This prompt appears as the first and only screen for native opt-in and as the second pop-up screen for the custom opt-in.
- Opt-in CTR: Percentage of users who have subscribed to push notifications out of the total number of users who view the opt-in screens.
Was this article helpful?