Architect Journey: Web Push Channel Analytics
- 10 May 2024
- 2 Minutes to read
Architect Journey: Web Push Channel Analytics
- Updated on 10 May 2024
- 2 Minutes to read
Article Summary
Share feedback
Thanks for sharing your feedback!
Suggested readings: Architect Channel Web Push, Using Web Push, Architect Web Push Analytics
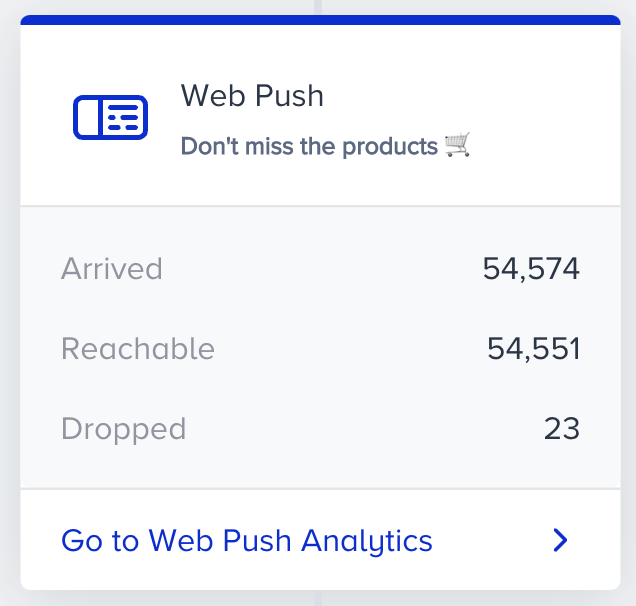
When you are at the Web Push element on the canvas, you can click the Go to Analytics button on the element to see the analytics of this channel.
To filter the Web Push metrics, you can:
- Select a goal to evaluate your web push conversions and conversion rate metrics using the dropdown on the top left corner of the page.
your title goes here
Purchase is the default goal set on your account. You can set goals on the top bar of the canvas when creating your journey. Read more on Set Goals.

- Select a time range using the date picker on the top right corner of the page.
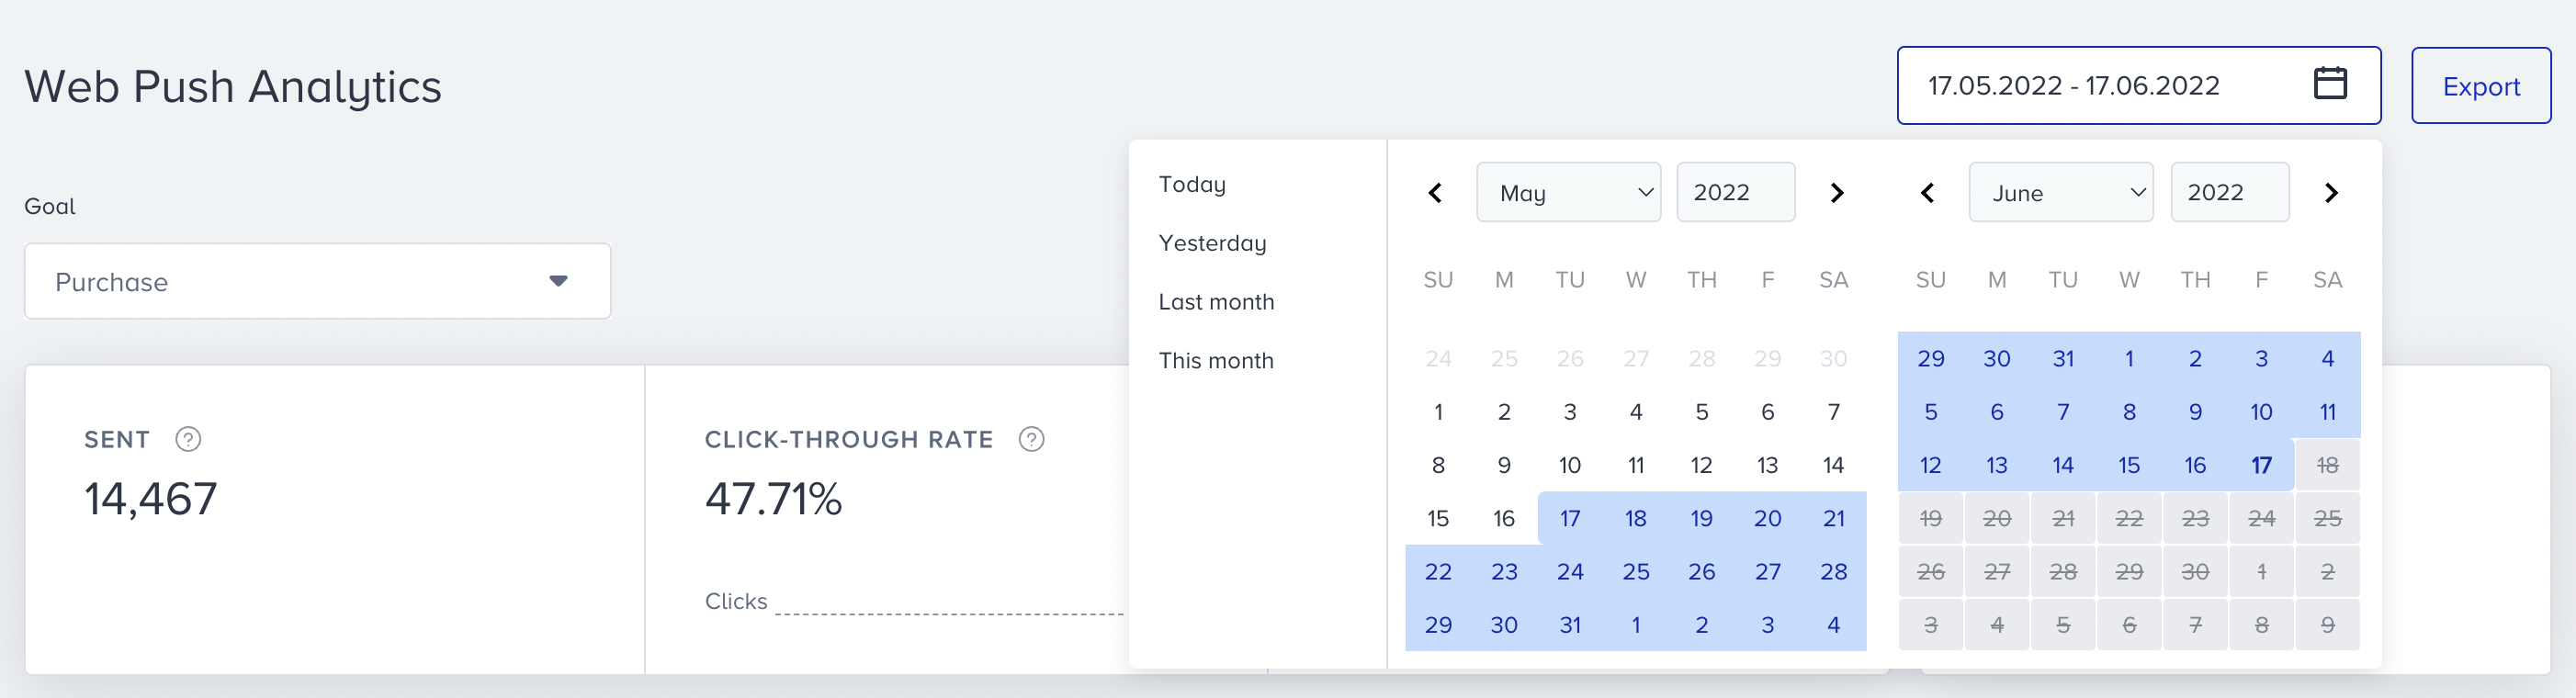

You can also click the Export button to export your report in Excel format.
Narrowing down your results, you can see the following metrics:

You can see the incremental or decremental changes in sent, click-through rate, conversion rate, and revenue based on the selected date range. For example, when you select "last month", it will compare the last month to the previous month. When you select 7 days on the date picker, it will compare the selected 7 days to the previous 7 days.
- Sent: The number of messages addressed to the users via Web Push.
- Clickthrough Rate: The percentage of times that the users clicked the messages to the delivered messages via Web Push.
- Clicks: The number of times that the users clicked the Web Push.
- Conversion Rate: The percentage of the successful goal accomplishments to the delivered messages via Web Push. Conversion rate changes according to the Conversion Goal selection on the dropdown.
- Conversions: The number of successful goal accomplishments via Web Push. Conversions change according to the Conversion Goal selection on the dropdown.
your title goes here
Conversion goal duration settings affect the conversions and revenue metrics of your campaigns. For example, the conversion goal duration of your campaign is 1 hour. You see this campaign but do not make a purchase within the next hour. In this case, no conversion or revenue is displayed on the stats for this campaign.
- Revenue: The total value of the purchases made via Web Push.
- Average Order Value: The division of revenue by the number of purchases made via Web Push.

The charts section displays the daily, weekly, or monthly details on a line chart based on your time range selection, and the metric that you can select using the dropdown on the top left corner of this section. You can also see the data for desktop and mobile devices separately on this chart.
The last section of this page allows you to view the following web push-related details of the campaigns that you send on a specific date range separately for desktop and mobile devices:

Was this article helpful?