Smart Recommender Campaign Level Analytics
- 31 Jan 2024
- 2 Minutes to read
Smart Recommender Campaign Level Analytics
- Updated on 31 Jan 2024
- 2 Minutes to read
Article Summary
Share feedback
Thanks for sharing your feedback!
Smart Recommender Campaign Level Analytics enables you to track the ROI of each campaign according to campaign goals and variants of the campaign created on the design step within the time range you set. To see the campaign level analytics,
1. Click on Analytics of your campaign on the listing page of the Smart Recommender.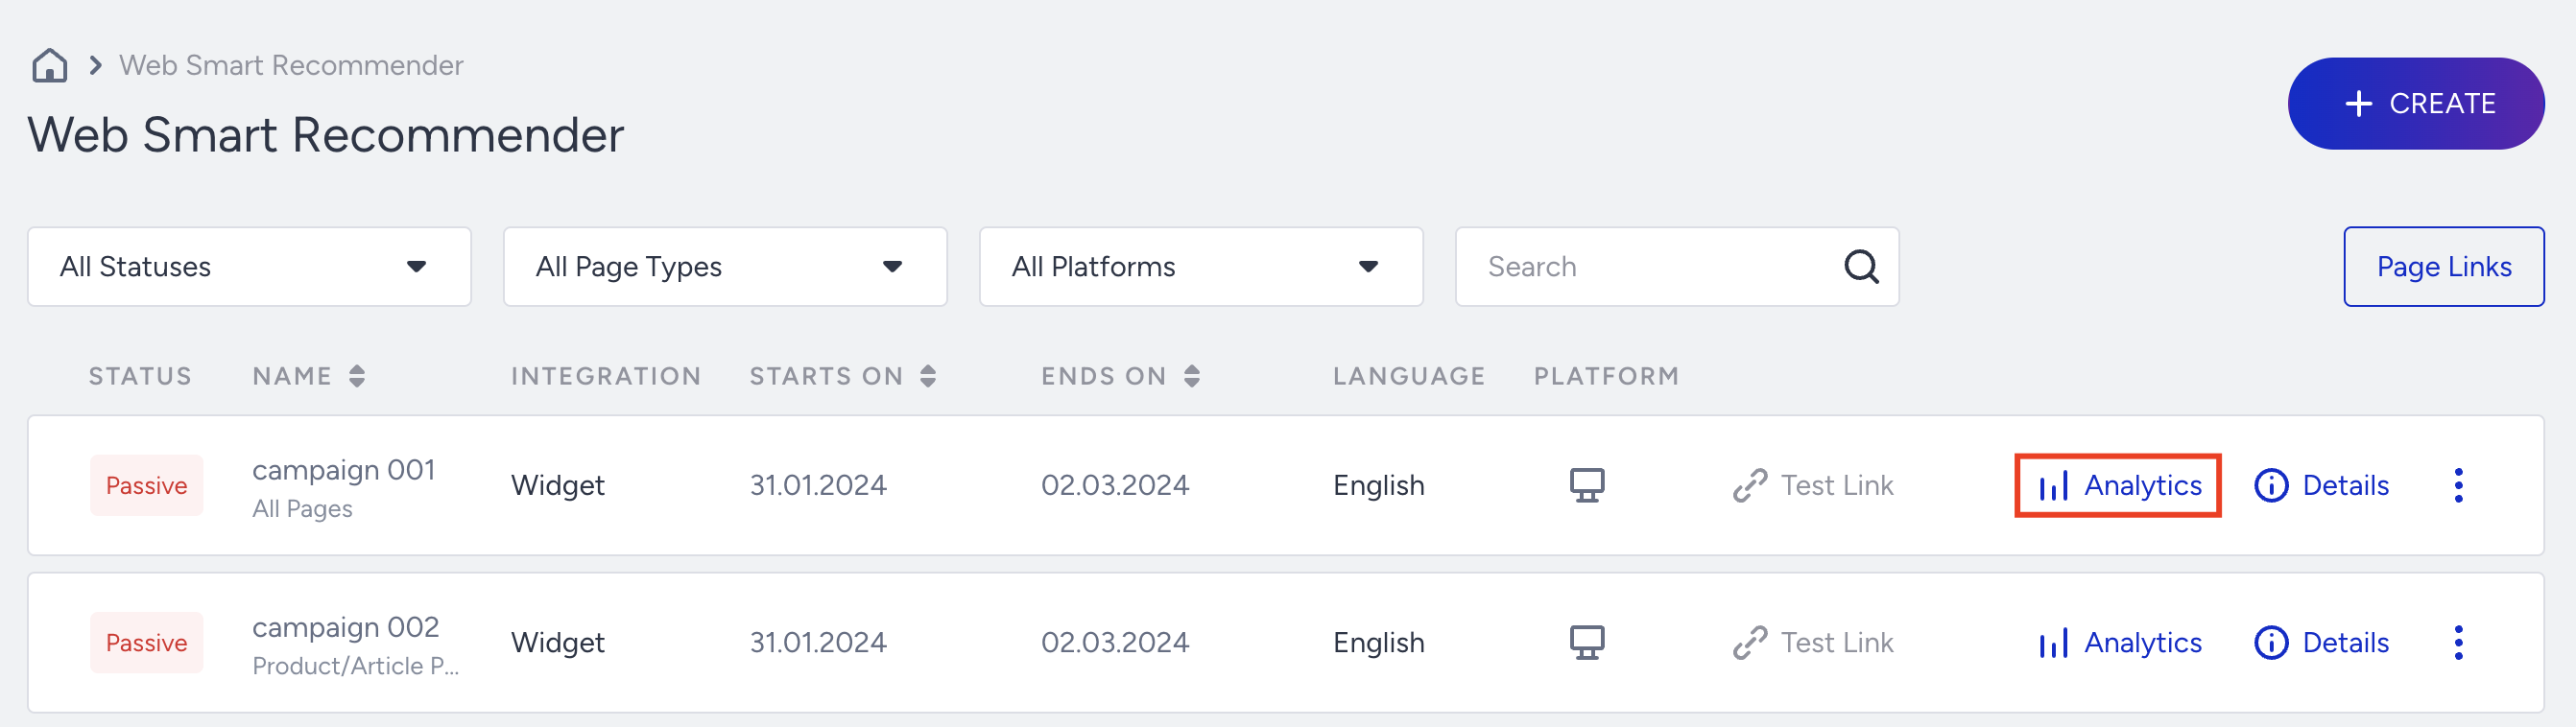
2. Once you land on the Analytics page, you can select which goal metric you wish to see from the drop down menu of Goal.

3. You can also select the Variant to see its detailed statistics from Base Group.

4. When you select Goal, Base Group and time range, you will be able to analyze the results of your campaign.
Summary Metrics
- Impressions: are the number of times that the users viewed your variant.
- Days Active: is the number of days in which at least one variant has been viewed more than 10 times.
- Uplift: Conversion Rate Uplift of the most successful variation compared to baseline.
- Incremental Value: Calculated the difference of the most successful variation compared to baseline.
 5. Metrics Dashboard provides graphical information about each active variant on your campaign including the control group. From the dropdown menu, you can select which information to be visualized among choices of Conversion Rate, Conversions, Impressions.
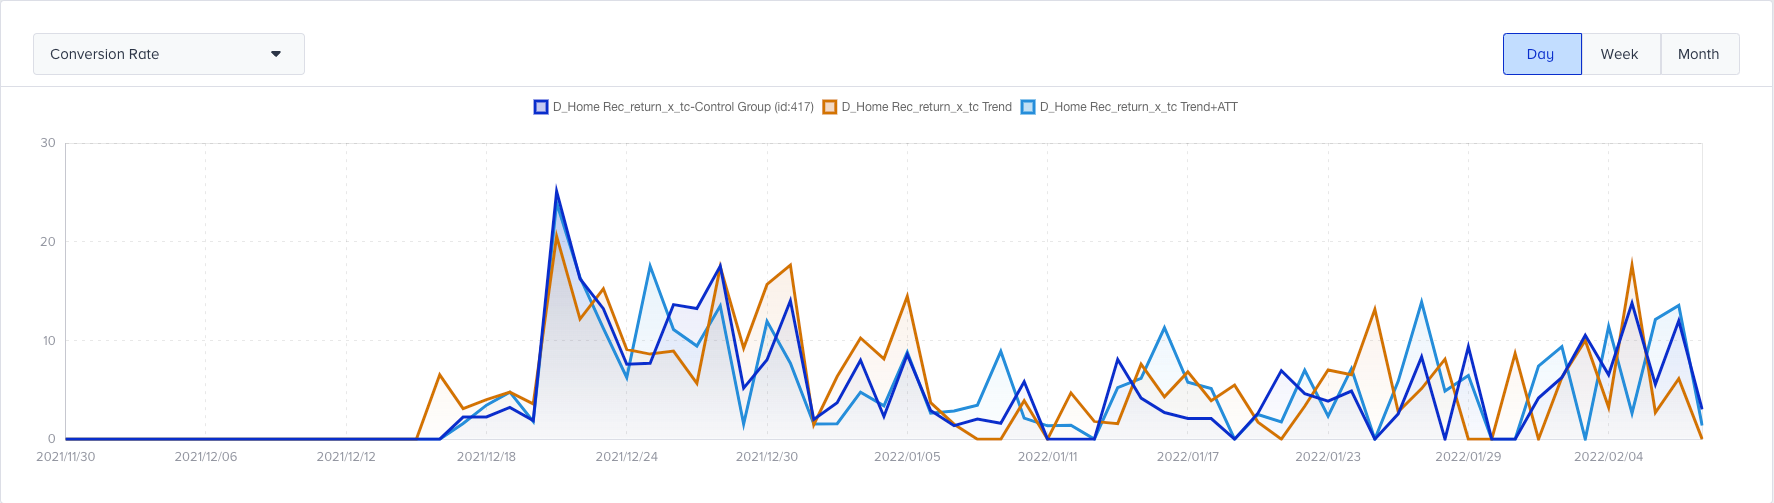
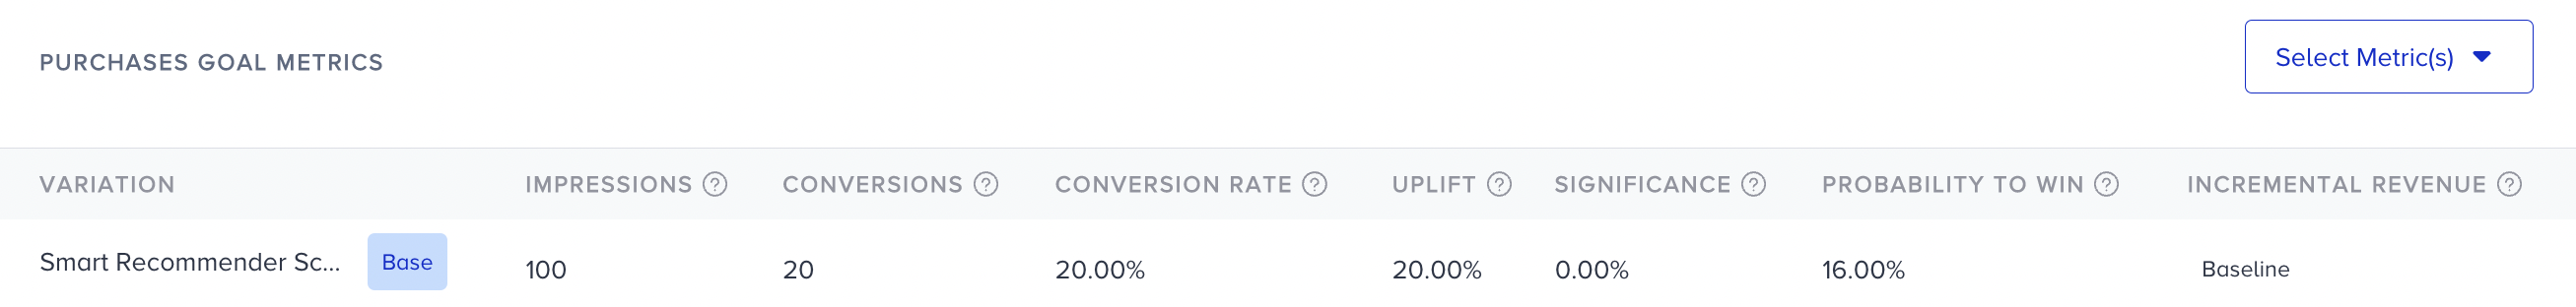
6. From the dropdown menu, you can select Goal Metrics to be shown in the dashboard for each active variant in your selected campaign.
- Impressions: Number of unique visitors which became part of the variation.
- Conversions: Number of successful primary goal occurrences.
- Conversion Rate: This metric indicates the percentage of your visitors who complete the goal for your variant.
- Uplift: Conversion rate uplift is calculated based on the ratio of the conversion rate of the variation to that of the control group.
- Significance: Significance is a global statistical term used for A/B Testing reports. It determines whether a report is reliable to take an action depending on it. Significance depends on the size of the experiment, meaning the number of impressions, and the difference in the performance, in other words, uplift. The score showing if the data is enough to keep or end the experiment. For example, if Significance is <95%, the experiment is not significant yet.
- Probability To Win: Probability to Win is the likelihood of this variant to best the other variant(s) in the test. This percentage is calculated by using Bayesian Significance, based on the collected data so far.
- Incremental Revenue: It is the extra revenue generated by the variation, calculated by finding the difference between the variation and the control group.
- Incremental Conversion: This metric is the number of extra conversions generated by any group of personalization. It is calculated based on the comparison of the variant performance to the control group performance.
- Revenue: is the value of purchases made from your variant.
- AOV(Average Order Value): is the ratio of the revenue to the total number of sales.
- AOV Uplift: Average order value uplift is calculated based on the ratio of the average order value of the variation to that of the control group. The difference between the average order value performance of the variation and the control group will give this uplift.
7. You can export the Statistics data in desired time range in two different ways.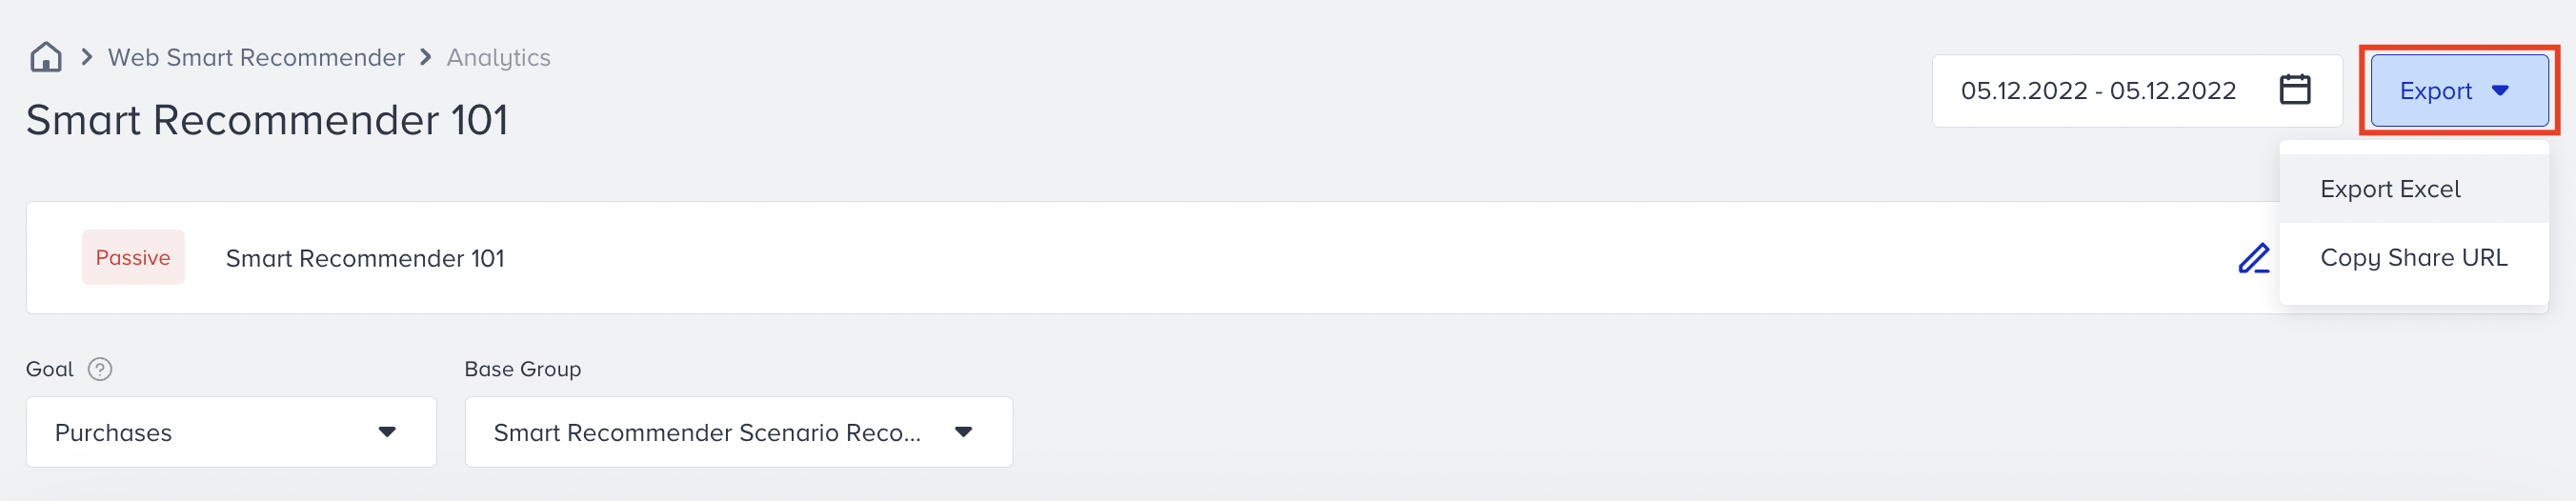
Was this article helpful?