Smart Recommender Analytics
- 01 Nov 2023
- 8 Minutes to read
Smart Recommender Analytics
- Updated on 01 Nov 2023
- 8 Minutes to read
Article Summary
Share feedback
Thanks for sharing your feedback!
For all the Web Smart Recommender campaigns on your website, Insider collects and visualizes usage metrics in order to show the revenue and engagement performance impact of web smart recommender campaigns. Smart Recommender Analytics Dashboard presents revenue breakdown with direct and discovery aspects and user engagement journey breakdown (from the first impression to the purchase of a product) as the overall summary metrics.
You can also find campaign analytics with A/B and non A/B test breakdowns, product analytics with product - algorithm relations, and the product category analytics that enable you to generate merchandising insights.
To see the performance of Smart Recommender Campaigns with specific metrics and detailed reporting, navigate to Reports > Smart Recommender Analytics to reach this dashboard.
Personalize metric calculations: The Attribution Window
The Web Smart Recommender has the objective of “creating a product purchase” that can happen days, even weeks after user engages with a recommended product. The time allowed between these two actions is dynamic and can be changed whenever you desire.
In order to see the true performance of smart recommender campaigns, Insider offers a dynamic set up that allows you to customize “the time allowed between an engagement (click) and the goal action (purchase)” that is called the Attribution Window.
The attribution window enables you to see the true performance. For example, think that you are a fast moving goods retailer and your customers complete a purchase on the same day or even on the same session. However, a customer of a furniture retailer can complete their order in 14 days or even in a month. If both companies use the same attribution window of 7 days, the recommender analytics won’t include the furniture customer's purchase of a recommended product on the 10th day after click. Therefore, you won’t be able to see the true performance. Hence, to tailor your analytic metrics calculation according to your end users behavior, select the window span that suits your customer behavior.
The attribution window is the time allowed for an end user to complete the purchase of a clicked product. It can be same session, 1 day, 7, 14 or 30 days.
- Same Session: The session starts when the user lands on the website and is terminated in 30 minutes of inactivity or at midnight. For the campaigns and products that have the click and purchase logs with the same session ID will be counted as a session-based conversion. Insider sends one viewable impression event per session. But a user can have multiple clicks, add to carts, and purchases from the same campaign on the same session.
- 1 Day: Purchase must be completed within the following 24 hours of the click event.
- 7 Days: Purchase must be completed within the following 7 days of the click event.
- 14 Days: Purchase must be completed within the following 14 days of the click event.
- 30 Days: Purchase must be completed within the following 30 days of the click event.

How attribution window is applied to the direct revenue?
| Events | Click | Purchase | Revenue |
|---|---|---|---|
| Day 1 | Product 1 | ||
| Day 5 | Product 2 | Product 1 | Revenue 1 |
| Day 8 | |||
| Day 13 | Product 2 | Revenue 2 | |
| Day 25 | Product 3 | Product 3 | Revenue 3 |
- Product 1 is clicked on day 1 and purchased on day 5, which means it took 4 days for the end user to complete the conversion funnel.
Revenue 1 will be added to direct revenue when a 7, 14, or 30-day attribution window is selected.
- Product 2 is clicked on day 5 and purchased on day 13, which means it took 8 days for the end user to complete the conversion funnel.
Revenue 2 will be added to direct revenue when a 14 or 30-day attribution window is selected.
- Product 3 is clicked on day 25 and purchased on day 25 but not on the same session, which means it took 1 day for the end user to complete the conversion funnel.
Revenue 3 will be added to direct revenue when a 1, 7, 14, or 30-day attribution window is selected.
Filter your results
To narrow down the analytics, you can filter your results.
- You can filter your results via the date picker which helps you select the time interval you wish to view.
- You can apply page type and platform type filters on the dashboard. Using them will enable you to list campaigns that have the same page and platform types so that you can make a reasonable comparison.
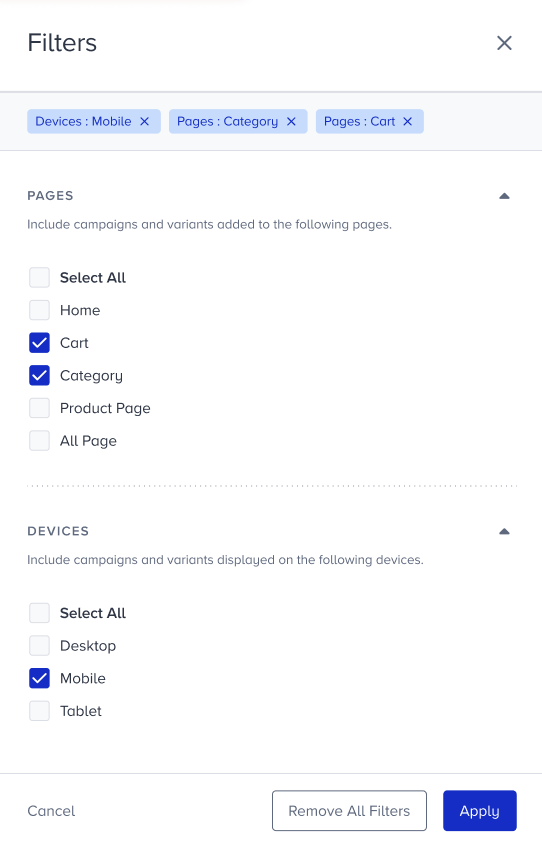

You can also observe the campaign summary in different statuses after you filter your results.
Revenue Performance
You can visualize "discovery” and “direct attraction” effects of Smart Recommender separately through Direct and Assisted Revenue metrics. 
- Direct Revenue is generated from sales of recommended and clicked products from the recommender carousel during the days selected from the attribution window. As the attribution window increases, more time will be allocated for a click to become a conversion. As a result, it is expected to see a higher direct revenue value as the window increases.
- Orders with Recommended Products are the number of checkouts containing at least one recommended product. You can compare it with your total checkout count and see how recommendations are infusing into your orders.
- Assisted Revenue, or discovery revenue in other words, shows the revenue generated from products that are not recommended, but purchased in the same session with a recommender interaction.
Engagement Performance
Users' journey, which starts from the first click interaction, with a web recommender and ends with purchasing a recommended product, is visualized with a funnel structure on Engagement Summary Metrics.
- Impressions: Once the campaign container enters the viewport of a user, the viewable impression is triggered for the campaign and all products on the recommender carousel. Your title goes hereImpression only counts when campaign enters the screen, not when the page is loaded.
- Click-through Rate (CTR): It is the number of clicks on a recommendation carousel divided by the number of viewable impressions on the recommendation carousel.
- Clicks: The click event is triggered when a user clicks on the recommendation carousel (outside the product cards, title, arrows, etc.), or anywhere on the product card (image, image button, CTA buttons, etc.).
- Add to Cart Rate: It is the number of add-to carts of a recommended product, divided by the number of viewable impressions.
- Add to Carts: Add-to-cart event is triggered when a user clicks on the ATC button from the product detail page, or on the product card on the recommender carousel.
- Conversion Rate (CR): It is the sum of purchased recommended products (direct conversions) divided by the sum of viewable impressions.
- Purchases: It is the number of purchased recommended products.
Your title goes here
CTR and CR takes impression into count, not the clicks.
You can also view those metrics on daily, weekly or monthly basis on the timeline.
Campaign Analytics
The campaign analytics table enables you to create relations between campaign parameters such as page type, algorithm, etc. and performance. 
You can compare the results to see which algorithm performs the best on your category or cart page. You can also see the breakdown of the variants inside a campaign (A/B) with its performance metrics, which allows you to select the best performing variant and improve campaign strategies.
The main rows on the table are the Web Smart Recommender campaigns and the nested rows are the variants inside the campaign. In order to look at the variant performances of a campaign, click on the main row and variants will be listed on the nested part. Lastly, you can analyze A/B and non A/B test campaigns separately so that you can focus the comparison for the campaigns with and without control groups.
Important Note on Variant Product Metric Collection
A user might click on a red shirt from the Web Smart Recommender campaign. Then, they can change the size or color of this shirt and proceed the journey with the blue color of the recommended shirt. In this case, Insider compares the clicked and purchased products to make sure that they have the same group code and are variants of each other. Consequently, add to cart and purchase logs of the variant product (blue shirt as in the example) will be added to the originally recommended and clicked product’s (red shirt as in the example) metrics. In essence, even if the user substitutes the recommended product with a variant, the revenue and engagement metrics associated with the variant will still contribute to the overall metrics. This approach ensures that no revenue is lost in the process.
For example, a user is recommended the L size of a t-shirt. After going to the detail page, the user decides and purchases the M size. In this case, the sale of the M size is written to the overall recommendation revenue and the campaign revenue which has recommended L size product.
Product Analytics
In addition to the campaign analytics, recommendations also provide insights regarding the product performances. From the product analytics table, you can see which products are performing best in terms of the engagement and revenue. On top of the performance metrics, product analytics table enables the transparency of algorithm-product relation based performance. This feature provides more insights on how an algorithm is performing for that product, or which products are creating more engagement compared to others.
When you click on a product on the product analytics table, you can see the algorithms that have recommended that product and generated revenue. In other words, trending, most popular, and other contextual algorithm outputs will be clear so that you can get insights regarding which products are more valuable to your users.
Category Analytics
One of the most powerful abilities of the smart recommender is enabling users to discover and engage with different categories. 
Seeing the number of products recommended from that category together with the total revenue generated from the sale of recommended products, you can benefit from category analytics to understand which element of your taxonomy performs the best in recommenders, especially regarding revenue and Click-through Rate (CTR).
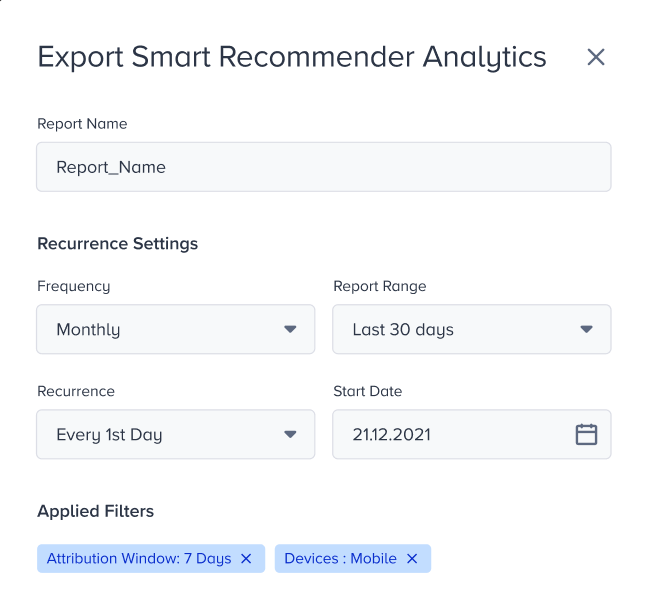
Export your results
You can create single and recurring reports. While exporting, overall page filters you applied are shown on the export modal. You can change them if you like.
- Single Report: The report is generated immediately with the filters applied on the page and shown on the “Reports” drawer on which you can access later. Single reports are stored for 1 week and then deleted from the created reports section.
- Recurring Report: Recurring report type offers recurrence settings on the drawer modal. You can adjust the frequency, report range, recurrence period, and start date. Together with the applied filters, the recurring report setting configuration is complete.
Video: The new Smart Recommender Analytics
Was this article helpful?