Overall Web Push Analytics
- 24 Apr 2024
- 4 Minutes to read
Overall Web Push Analytics
- Updated on 24 Apr 2024
- 4 Minutes to read
Article Summary
Share feedback
Thanks for sharing your feedback!
Overall Web Push analytics help you understand the performance of the push notifications you have sent. To access, navigate through Reports > Web Push Analytics.
You can see a summary of notifications and get analytics for the notifications targeted in the selected time range. You can also export the analytics for a custom date range together with the filters applied from this page.
Your title goes here
Bear in mind that the new metrics are gathered as of 01.06.2023. Therefore, when you filter the analytics page with a start date before 01.06.2023 in the date picker, only the old metrics will be displayed and the new metrics will be presented as N/A for the sake of simplicity. The same rule applies to analytics exports as well. The new metrics will only be presented when the start date selected in the date picker is greater than 01.06.2023.
Key Metrics
Narrowing down your results with the date picker, you can see the following metrics:
- Targeted: The number of recipients in your target audience generated based on the segmentation of your campaign. This is the audience count you see before launching your web push campaigns.
- Sent: The total number of Web Push messages addressed to the recipients.
- Dropped: Even though you initially target a certain count of users when you launch your campaign, some of these user tokens are not really targeted in your campaign funnel. The count of eliminated tokens is displayed as “Dropped”.
- Delivery Rate: The percentage of the Delivered to the Sent Web Push messages. In other words, it is the percentage of the users who have seen your message to the users who had the chance to see your message.
- Delivered: The number of Web Push messages successfully transferred to the recipients. In other words, these are the users that have received your message.
- Undelivered: The number of Web Push messages that weren’t addressed to the recipients by the service provider.
- Click-through Rate: The percentage of Clicks to the Delivered Web Push messages.
- Clicks: The total number of times that the recipients clicked on your Web Push message.
- Conversion Rate: The percentage of the Conversions to the clicked push messages.
- Conversions: The number of transactions completed after clicking the push message, within the conversion attribution window.
- Revenue: The value of purchases made via your Web Push messages, within the conversion attribution duration.
Unsuccessful Messages
You can analyze the reasons for the dropped and undelivered push messages.
Dropped
Under Dropped messages, you can analyze the reason why some of he user tokens were not targeted in your campaigns.
- Frequency Capped: The number of Dropped messages due to the Channel and Campaign Frequency Capping settings.
- Silent Hours: The number of Dropped messages due to the Silent Hours settings.
- Internal Errors: The number of Dropped messages due to various internal system issues.
- Service Provider Errors: The number of Dropped messages due to the transmission issues to the Firebase Cloud Messaging servers.
- Unsubscriptions: The number of Dropped messages due to user opt-outs.
Undelivered
Under Undelivered messages, you can analyze the reason why some of the push messages weren’t addressed to the recipients.

- Offline Recipients: The number of Undelivered messages due to the recipients who weren't online within the campaign Time to Live duration.
- Other: The number of recipients for which we have failed to receive delivered information due to unknown causes that might be system related.
Performance by Campaign Type
You can review and compare the overall performance of different campaign types. If you are not using Web Push API, it will not be visible. 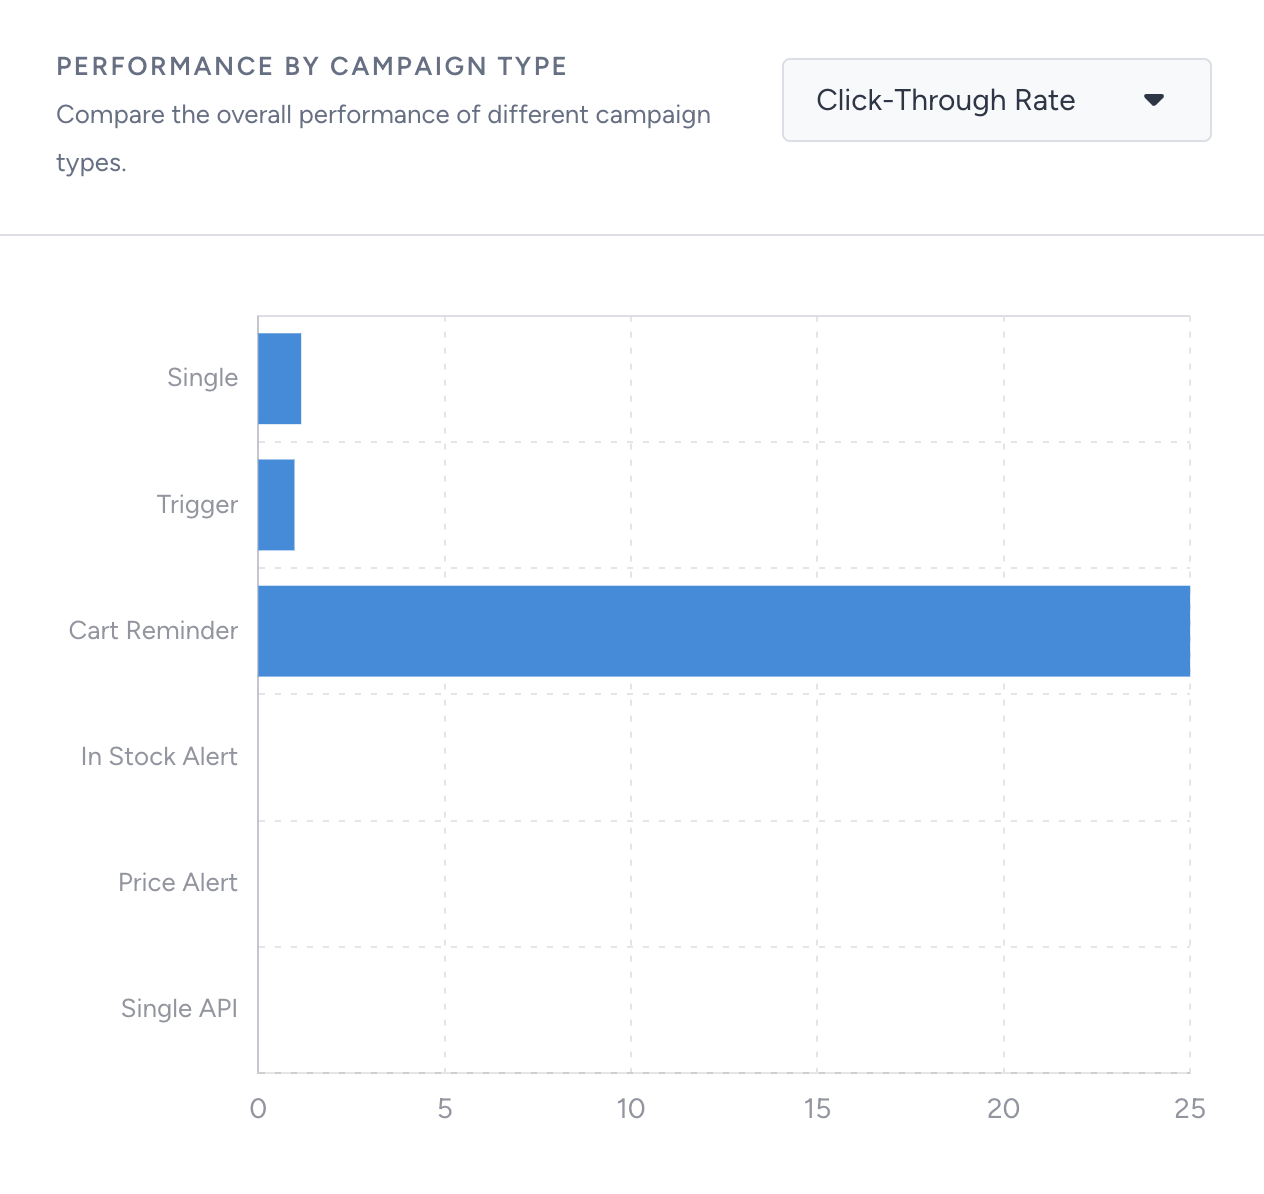
Selecting it from the dropdown menu, you can compare your campaigns based on number of campaigns, delivery rate, click-through rate, conversion rate and revenue.
Campaigns Metrics
You can see the details of the metrics based on your campaigns. The campaigns listed change in line with the filters you apply. You can reach a specific campaign easily with the Search box provided.
From the list of campaigns, once you click on a campaign name, you see its campaign level analytics. You can also reach the campaign level analytics when you click Details button against each campaign together with their details.

Salesforce Analytics for Web Push Custom Activity
If you have the Salesforce integration, you can track the logs of Web Pushes sent with the Messaging Custom Activity used in Salesforce Journeys on the Web Push Analytics page, where you can view data from both InOne and Salesforce journeys.
Campaign Metrics table displays campaigns including Salesforce campaigns and associated metrics. When you click on a campaign name, you will be redirected to the detailed campaign analytics.

To filter and analyze the performance of Salesforce campaigns or InOne campaigns separately, you can use the Campaign Source filter. 
Your title goes here
Certain filters like Type, Status, Tag, and Groups do not apply to Salesforce campaigns. These features are specific to InOne campaigns and you cannot use them for campaigns sent from Salesforce. Additionally, features like Frequency Capping and Silent Hour are not applicable in this context.
Getting the overall performance metrics of campaigns either from InOne or Salesforce when filtering by campaign source allows you to assess the effectiveness and impact of campaigns from specific sources.
Was this article helpful?