Single Journey Analytics
- 21 Nov 2023
- 6 Minutes to read
Single Journey Analytics
- Updated on 21 Nov 2023
- 6 Minutes to read
Article Summary
Share feedback
Thanks for sharing your feedback!
Single Journey Analytics page gathers all the metrics of a particular journey on a single page. You can reach this page by clicking the See Analytics button of each journey on the listing page.

This page consists of 4 sections:
- Live stats
- General stats
- Total channel metrics
- Channels by layers
Before starting to view your campaign analytics, you can select Journey Version, which allows you see the analytics of your campaign's old versions if you have edited it.

At the top right corner of the page, you can select a time range using the date picker to see the statistics for a specific period of time. You can also export the results using the Export button.

If you want to see the details of the journey, you can click the Details button below the date picker. You can click the Go to Journey button to see the journey flow.
Your title goes here
Days Active is the number of days in which at least one channel in the journey had more than 10 impressions.

Clicking the Information button, you can see the creation date, start date, end date, journey ID, eligibility duration, exit criteria, and notes on the side modal. 
For each journey, you can define your desired goal that you expect users to perform after clicking a message through the journey. You can use default or custom events that you create before to define your goals.
your title goes here
Purchase activity is always tracked by default through the journey even if you do not select purchase as your goal. You can always see the purchase activity as a conversion metric on the statistics pages (if you have online-selling on your web/mobile app).
your title goes here
Read more on Set Goals.
If you select a goal other than purchase for your journeys, this goal is included in the dropdown. You can also view the conversion and conversion rate metrics by selecting another goal.
If you have specified the event parameter of the event as a conversion goal, you can see it on the Goal dropdown.

Live Stats

You can see live stats on top of this page with the following metrics:
- Entered: The number of users who became eligible and started the journey.
- Dropped: The number of users who got dismissed from the journey due to channel reachability.
- Drop rate: The percentage of the users who dropped from the channels and ‘not reachable’ path to the users who entered the journey.
- Completed: The number of users who finished the journeys by reaching the last element or an empty path, excluding the not-reachable paths.
- Complete rate: The total number of completed divided by the total number of entered.
- Exited: The number of users who got dismissed from the Journey by matching the exit criteria.
- Sent: The number of messages addressed to the users via all channels in the journey.
You can click on each metric to see the timeline of Entered, Dropped, Completed, Exited, and Sent metrics.
General Stats

You can see the incremental or decremental changes in click, conversion, revenue, and average order value based on the selected date range. For example, when you select "last month", it will compare the last month to the previous month. When you select 7 days on the date picker, it will compare the selected 7 days to the previous 7 days.
Your title goes here
You can select a period of time up to 6 months since only the prior data of 6 months to be compared is available
You can see Total Clicks, Total Conversions, Total Revenue, and Average Order Value in graphics in this section.
- Total Clicks: The total number of times that the users clicked the messages via all channels in the journey. On the chart, you can see how many clicks the journey received based on their dates.
- Total Conversions: The total number of successful goal accomplishments via all channels in the journey. On the graph, you can see how many conversions journey received base on their dates.
- Total Revenue: The total value of purchases made via all channels in the journey. On the graph, you can see the total revenue amount of the journey got by conversions.
- Average Order Value: The division of Revenue by the number of purchases made via all channels in the journey.
Total Channel Metrics
Total channel metrics enable you to compare a channel type you have in your journey with the others. For example, if you have 3 web push channels on the flow, the metrics of this channel type are collected and written here. You can select any channel you have in the journey to see the following metrics of that channel.

- Number of Channels: The number of times the selected channel is used on the journey flow.
- Sent: The number of messages addressed to the users via a selected channel.
- Delivered: The number of messages delivered to the users via a selected channel. Impressions are counted as Delivered for the on-site and in-app channels.
- Clicks: The number of times that the users clicked the messages via a selected channel.
- Conversions: The number of successful goal accomplishments via a selected channel.
- Revenue: The value of purchases made via a selected channel in the journey.
Timeline graph shows the change of any selected metric within a given time interval for any selected channel.
While you can select channel metrics such as sent, click, conversion, and revenue in the first dropdown in the top right of the first graph, you can select time units such as day, week and month in the tabs.

You can also filter the specific channel step of the same channel category. For example, when you select the App Push channel on the Total Channel Metrics, you can filter which app push step you want to see on the timeline.

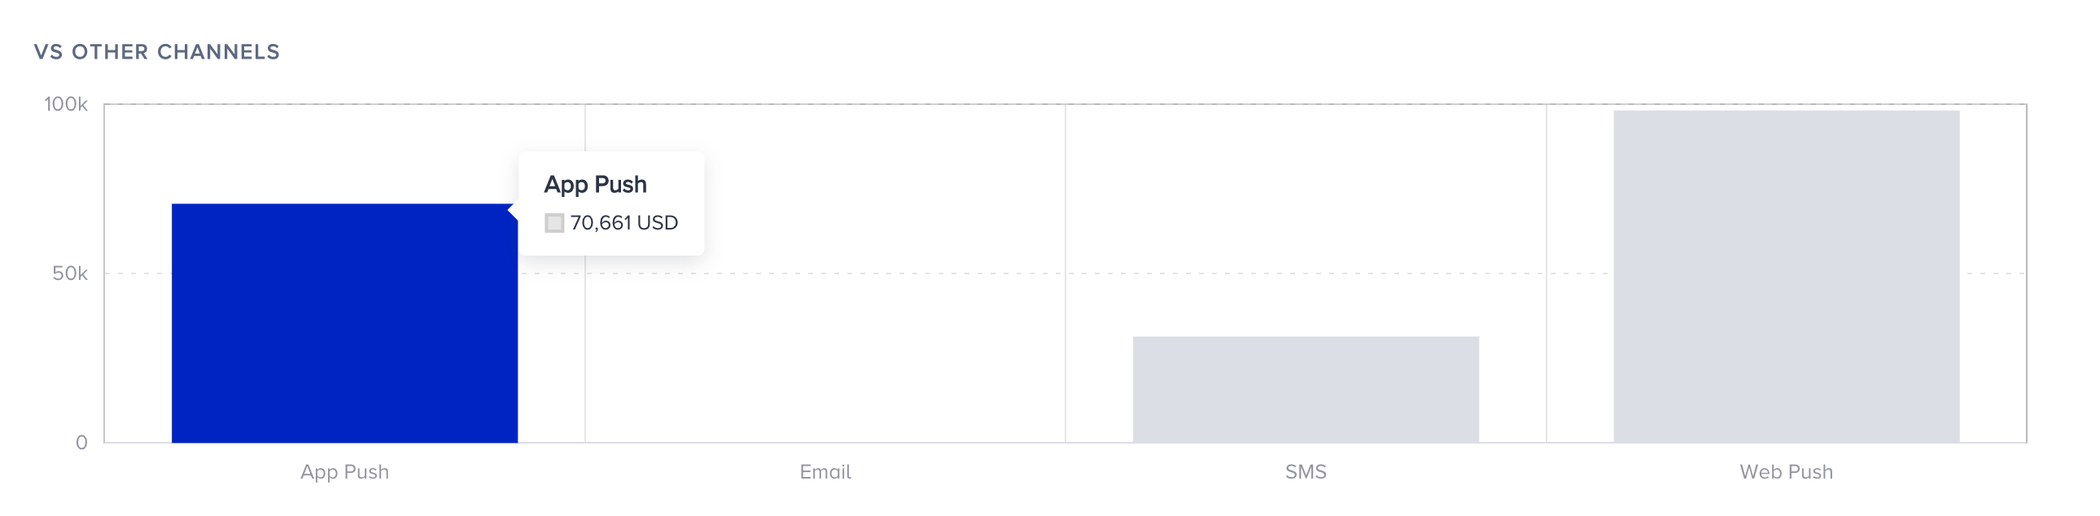
VS Other Channels graph shows the comparison of any channel you select in the Total Channel Metrics graph with other channels based on a metric you select in this section.
Channels By Layers
Channels by Layers enable you to examine the metrics of each channel individually within a layer of the journey. Layers show how many times you interact with a user within a journey, and aim to detect how metrics change when you send a second message to a user. There can be more than one channel in a layer. Layer breakdown helps you analyze and measure the metrics of your journey.

You can see the following metrics in this section based on channels, layers, and metrics that you can select using the dropdowns on the top right corner. You can add more metrics to your table or you can remove them, and scroll left and right on the table to see all metrics.

You can click on the Details button to see the respective channel details and message preview.

- Sent: The number of messages addressed to the users via a channel.
- Delivered: The number of messages delivered to the users via a channel. Impressions are counted as Delivered for the on-site and in-app channels.
- Drops: The number of users who got dismissed from the journey due to channel reachability.
- Drop Rate: The percentage of the users who dropped from the channel to the users who arrived at the channel.
- Total Opens: The total number of times that the users opened the Email.
- Unique Opens: The unique number of times that the users opened the Email.
- Open Rate: The percentage of users who opened the email.
- Total Clicks: The number of times that the users clicked the messages via a channel.
- Unique Clicks: The unique number of times that the users clicked the Email.
- Clickthrough Rate: The percentage of times that the users clicked your campaign to the sent messages via a channel.
- Conversions: The number of successful goal accomplishments via a channel.
- Conversion Rate: The percentage of the successful goal accomplishments to the sent messages via a channel.
- Revenue: The value of purchases made via a channel.
- Average Order Value: The division of Revenue by the number of purchases made via a channel.
Was this article helpful?