Overall App Push Analytics
- 26 Mar 2024
- 9 Minutes to read
Overall App Push Analytics
- Updated on 26 Mar 2024
- 9 Minutes to read
Article Summary
Share feedback
Thanks for sharing your feedback!
App Push Analytics page provides detailed insights about your app push campaigns, and helps you get a better understanding of your campaign strategies.
On this page, you can see overall metrics for all of your app push campaigns. You can narrow down the campaigns to see more related data. You can also see the campaign results one by one on the same page, and compare them.

The analytics dashboard consists of 5 sections: Pre-filters, Filters, Summary Metrics, Graphs, and Campaigns Table.
Pre-filters
You can apply Goal, Report Type, Platform, and Date Range pre-filters to your data to see the related insights. Each filter will have a default selected option. You can change these preferences to view the respective data.
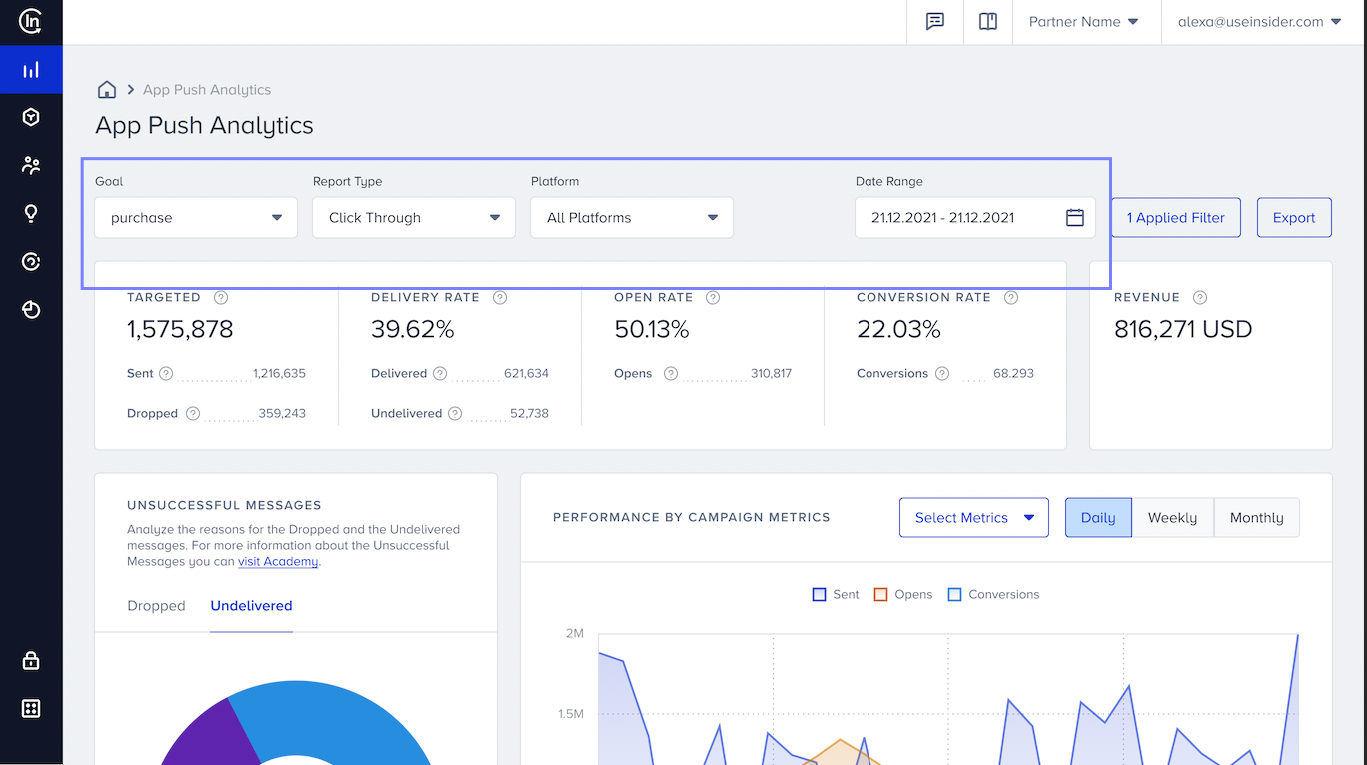
Goal
This option allows you to calculate your conversions via the selected event. The campaigns that do not have the selected event as campaign goal will not be listed on this page as their conversion automatically becomes zero (0) for the selected event.
Platform
You can see 3 platform options: All Platforms, iOS, and Android. You can see the results according to the device platform types.
Date Range
You can select specific date ranges to view your data. When you select a time range, campaigns that have metrics for the selected range and contribute to the metrics overall are listed on the dashboard.
Filters
You can apply different types of filters to view only a selected group of campaigns.
To apply filters, click the Filters button on the right of the page to see the filters modal.
Filters are not mandatory but optional. You can use them to narrow down the campaigns that are included in the stats.
The filter options are Type, Goals, Status, Control Groups, Opens, and Tags.
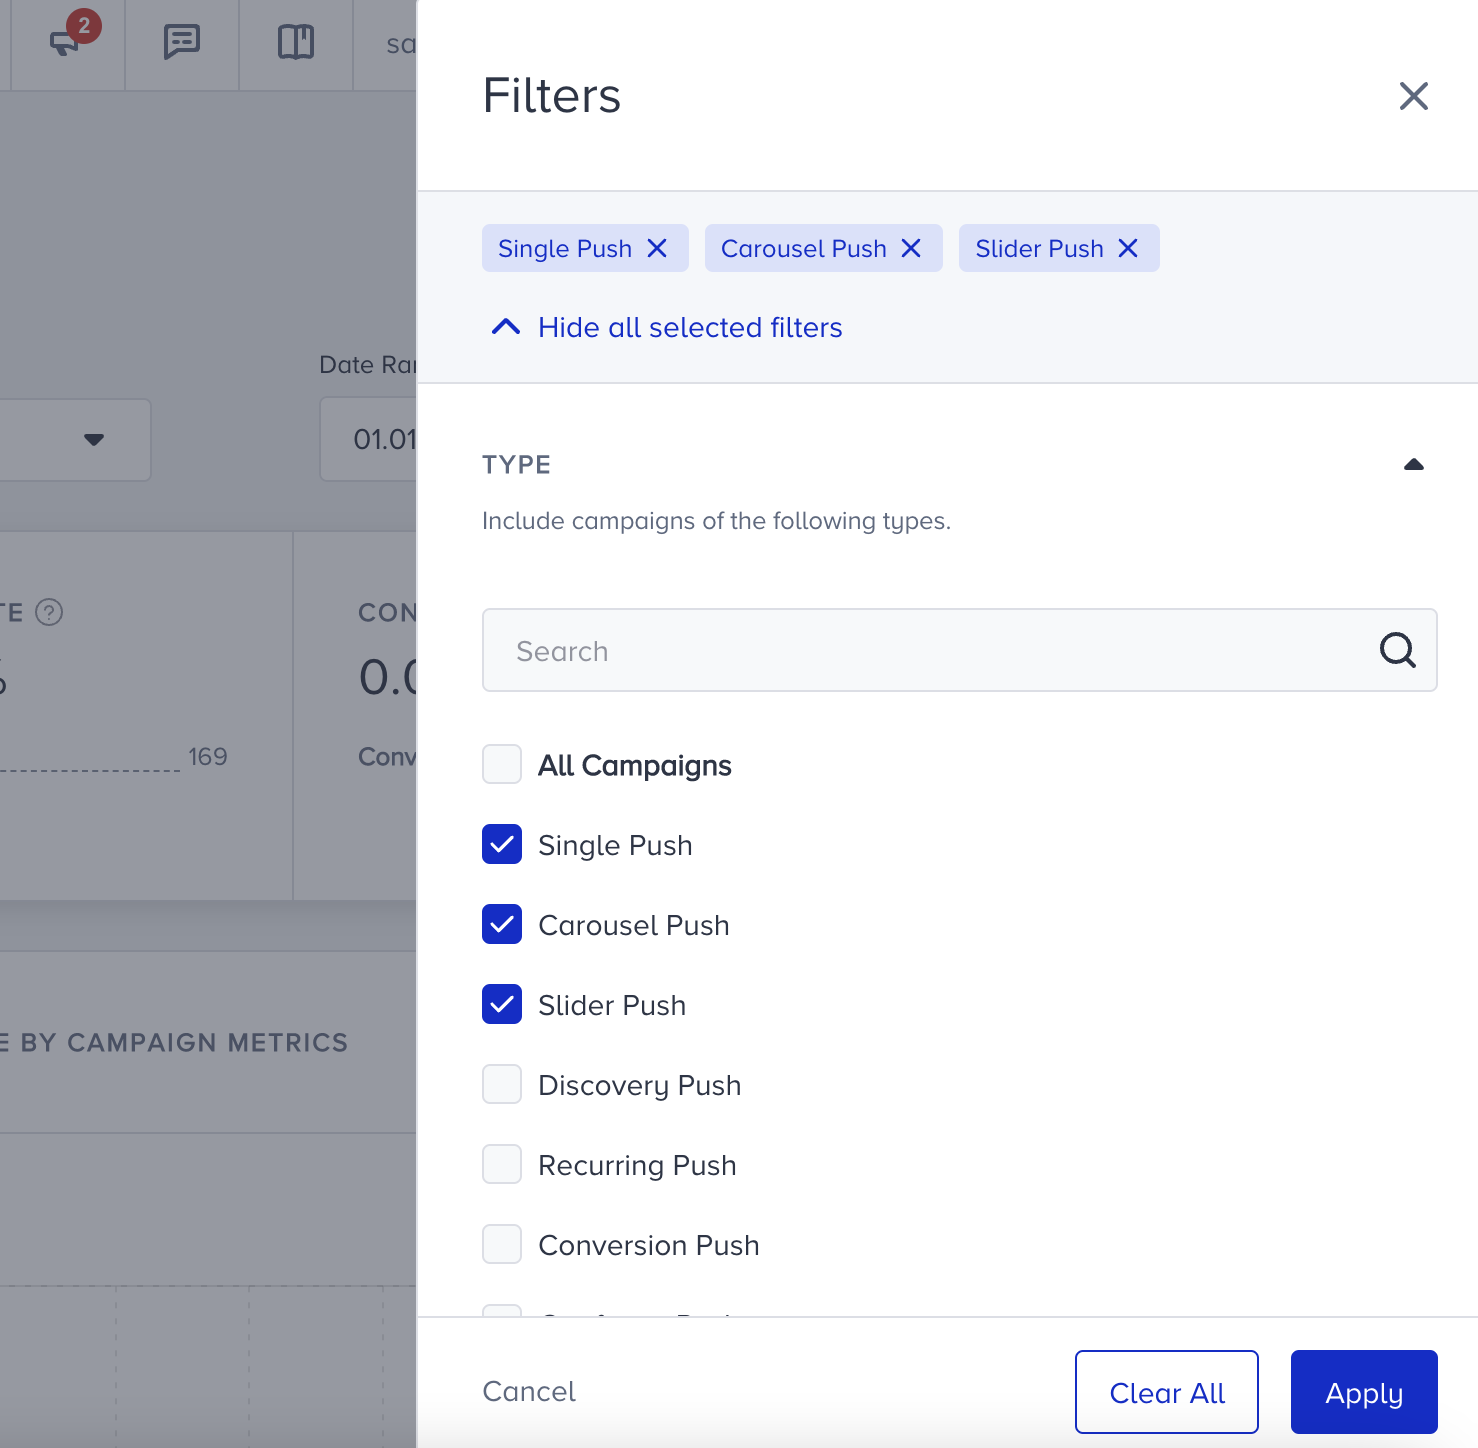
Type
Type helps you filter your campaigns based on the campaign type. The available options are Single, Carousel, Slider, Discovery, Recurring, Conversion, Geofence, and Cart Reminder.
You can select more than one campaign type at the same time, or the All Campaigns option to see the metrics for all types.
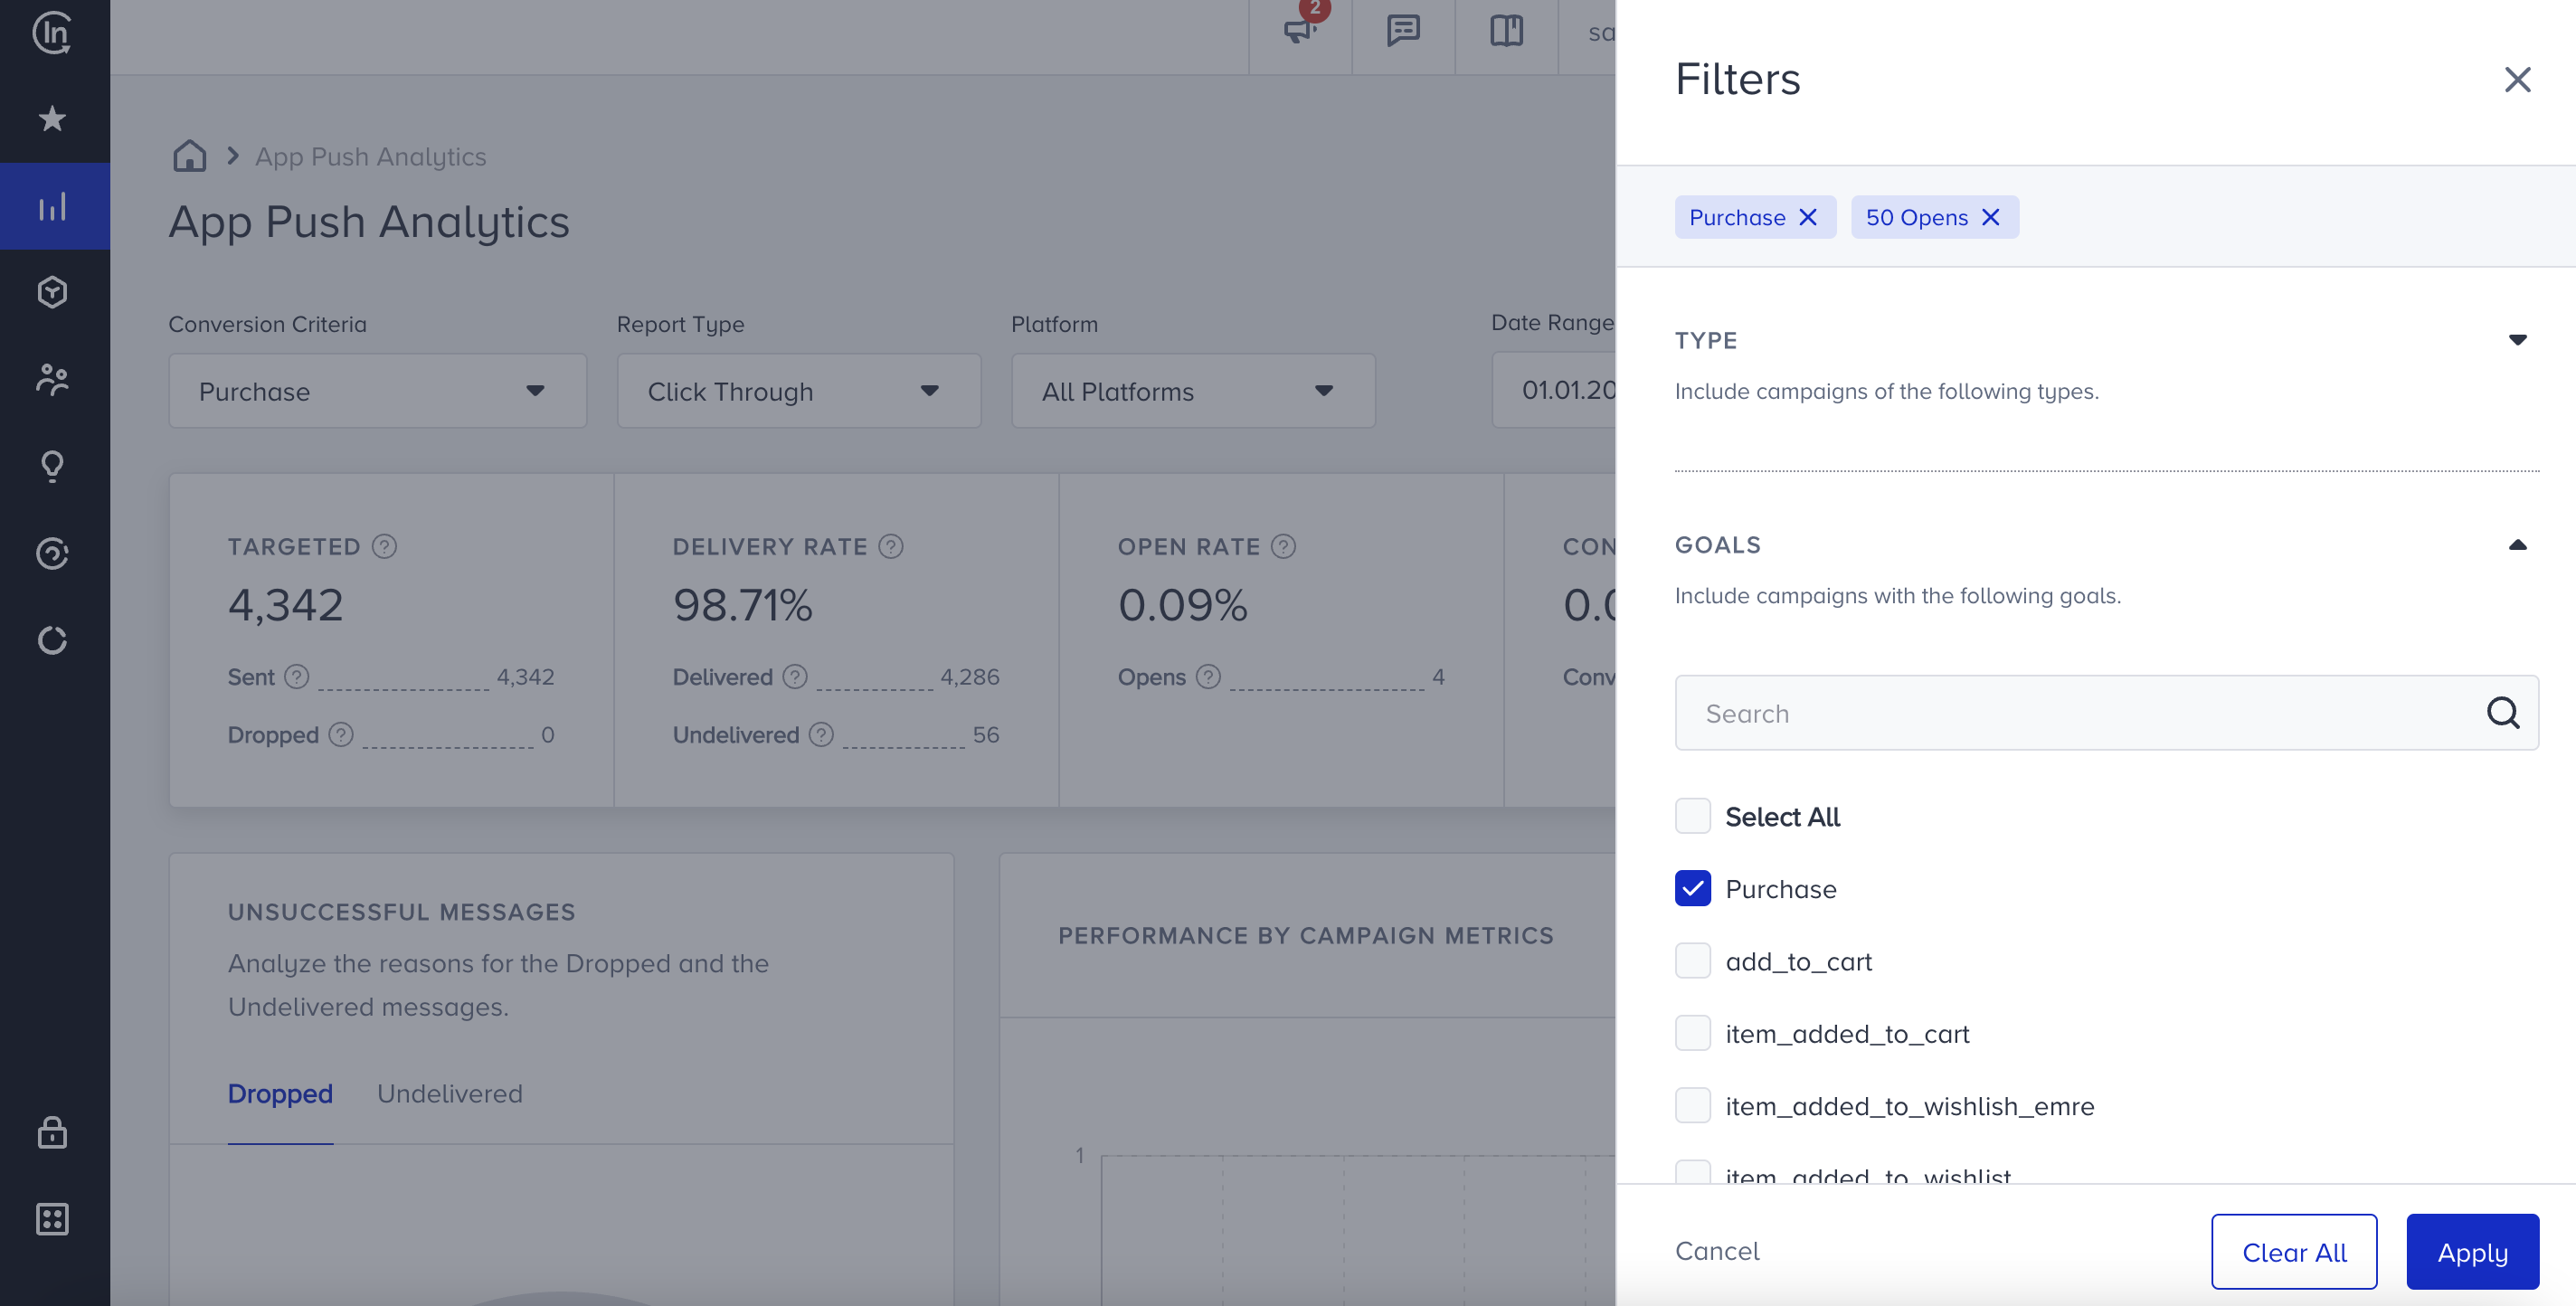
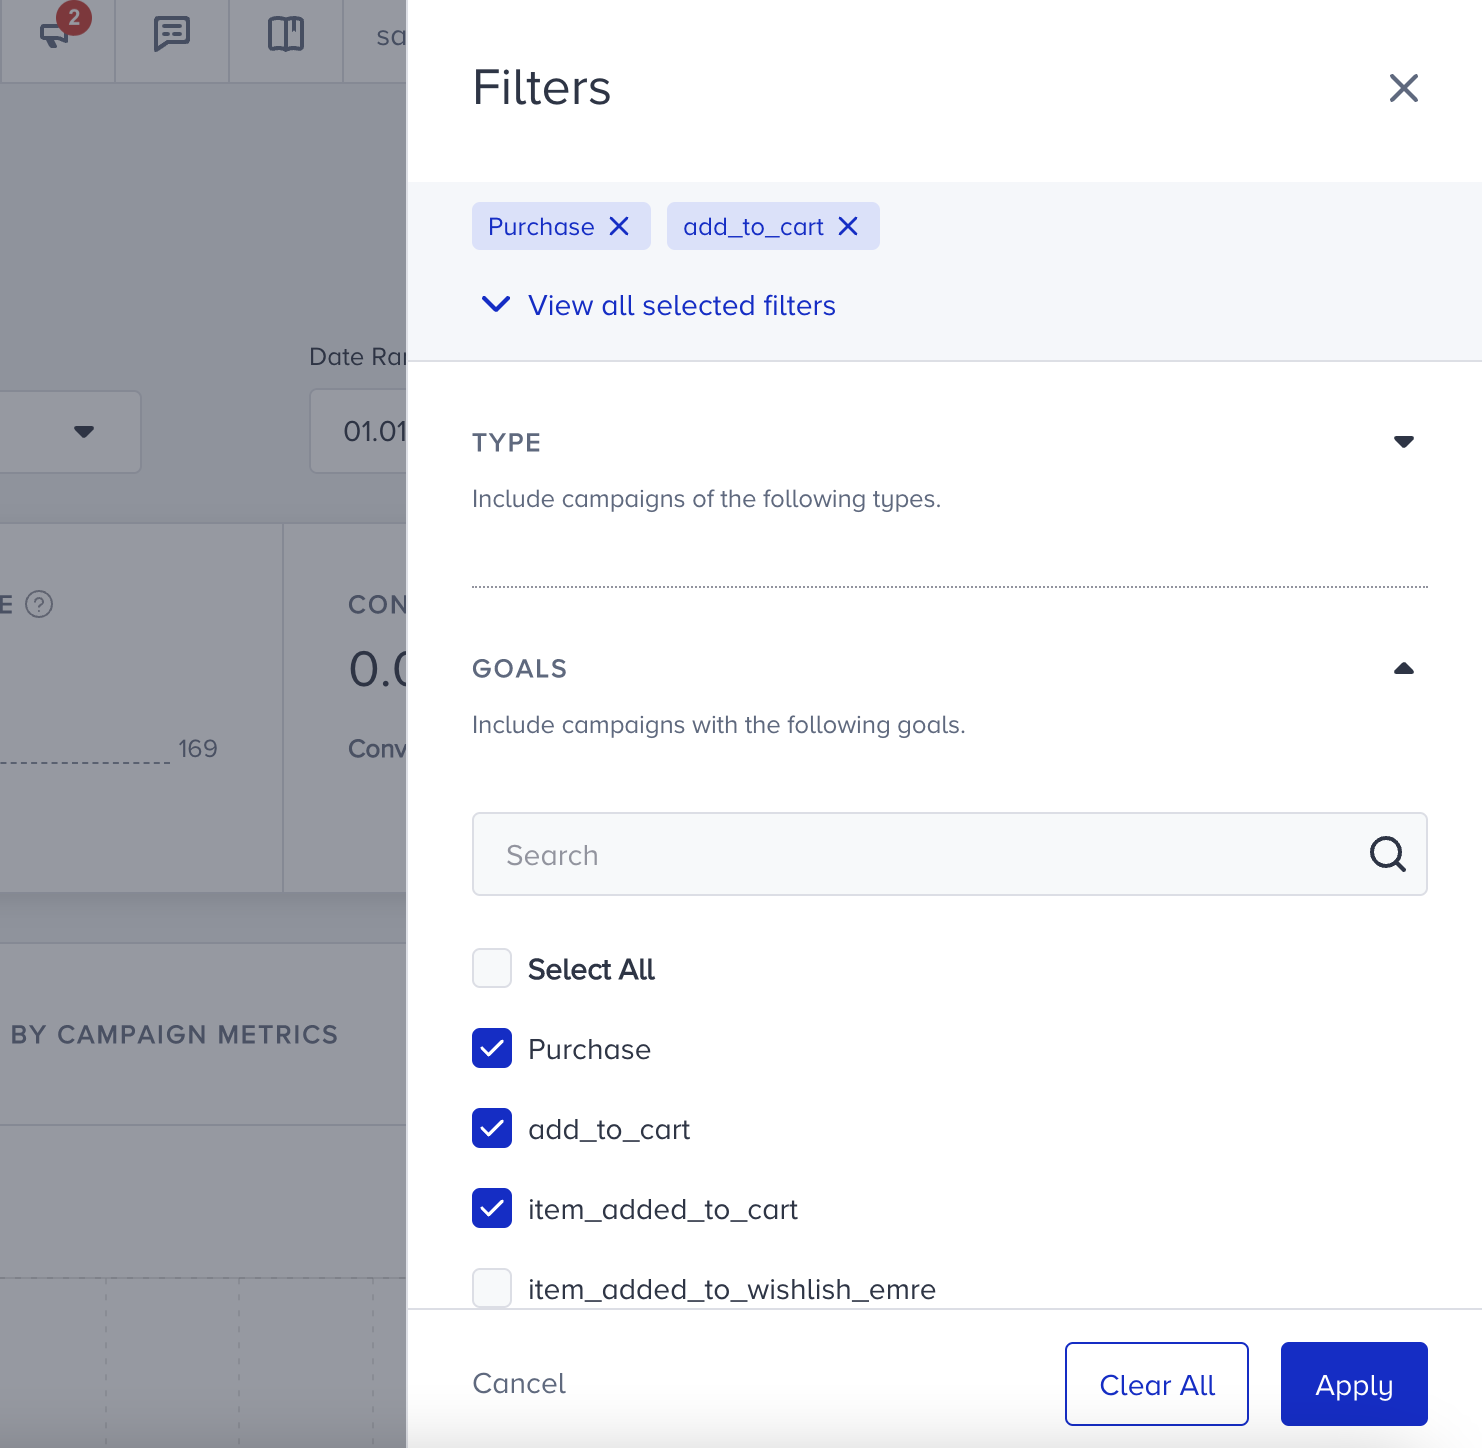
Goals
This filter allows you to get the campaigns that have the selected goals. Campaigns can have up to 3 different goals. When you select any event, the campaigns that has this event as one of the goals will be listed on the dashboard. For example, if you want to see the campaigns with the Purchase goal only, you can select the Purchase option and get the campaigns with this goal.
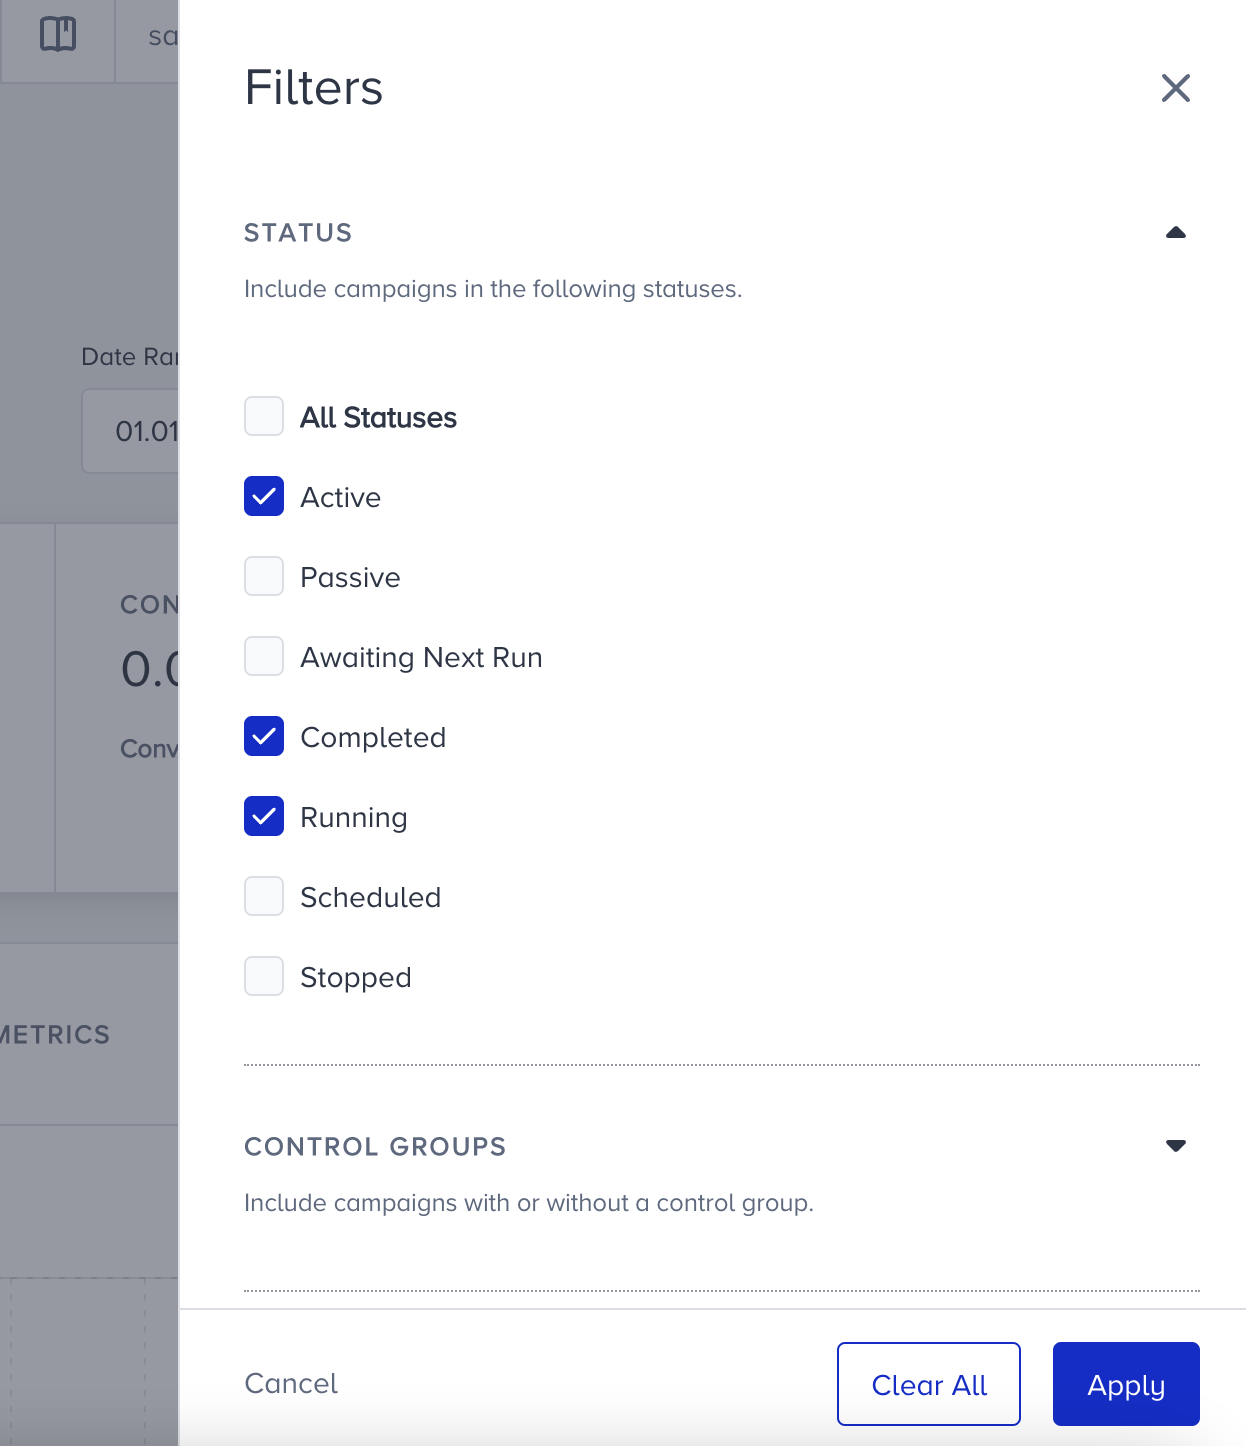
Status
Status helps you see the campaigns on a specific activation status. For example, you can see the campaigns that are Active, Completed, and Running.
Control Groups
Control group metrics are in the dashboard by default. This filter helps you hide the metrics of the control groups from the data.

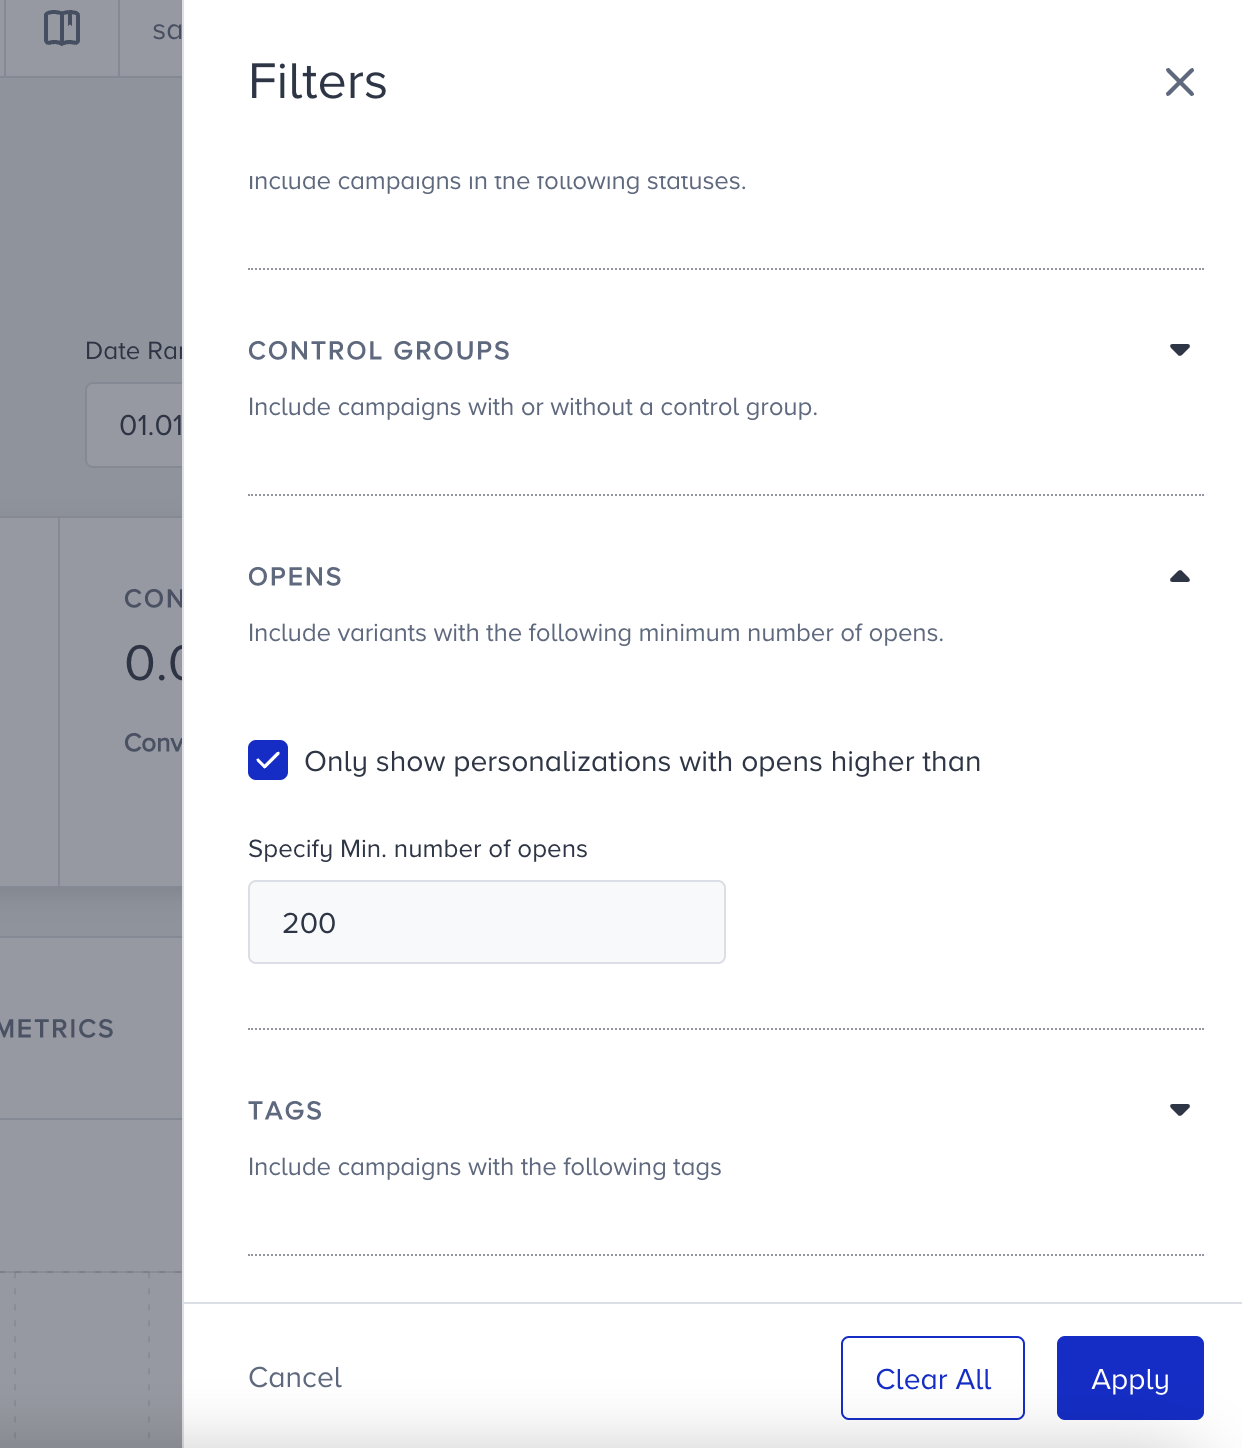
Opens
This filter allows you to set up a minimum limit for the open count of the campaigns. For example, if you want to see the campaigns with more than 200 opens, you can set this filter to 200.
Tags
Tags option helps you see campaigns only with a specific tag. You can select your tags and filter the campaign list on the dashboard. For example, you can filter them by a Black Friday tag you created before to see the respective metrics.
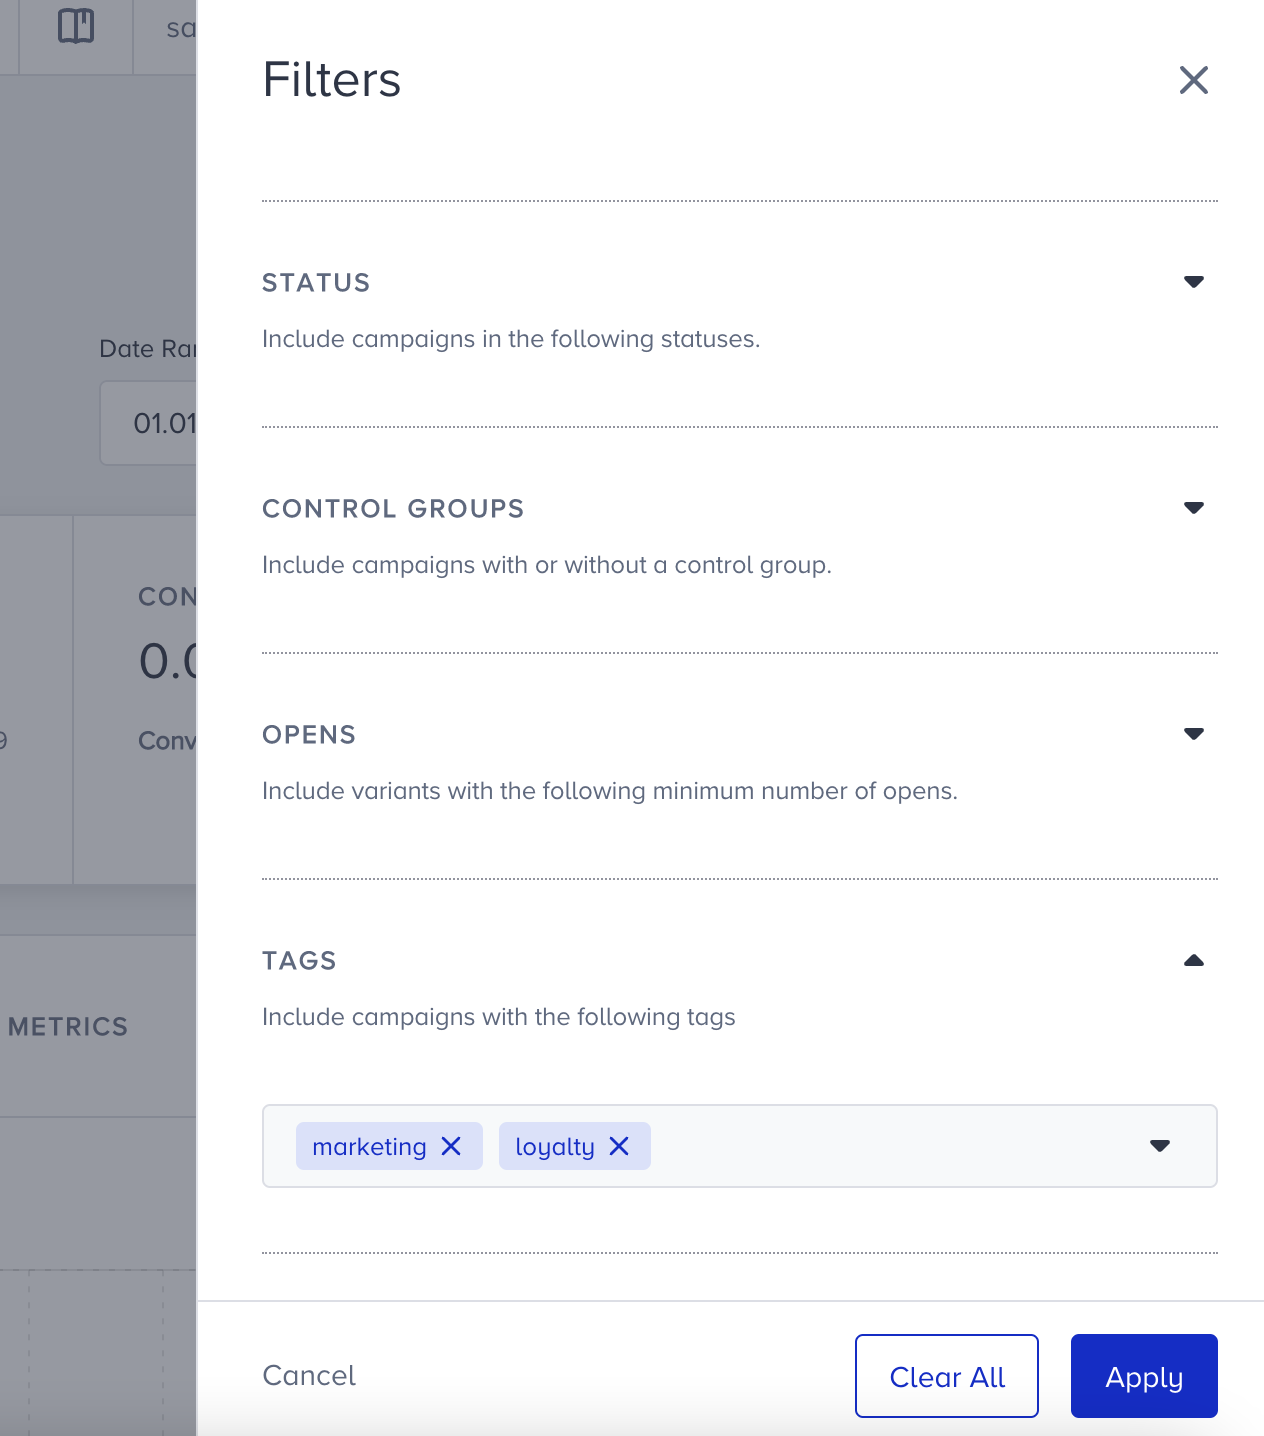
Above the filters modal, you can see all applied filters. You can add/remove any filter at any time, and clear all of them at once. Make sure to click the Apply button to see the filters applied on the data.
Export
You can export your App Push analytics easily.
1. After you decide which data to export, click the Export button.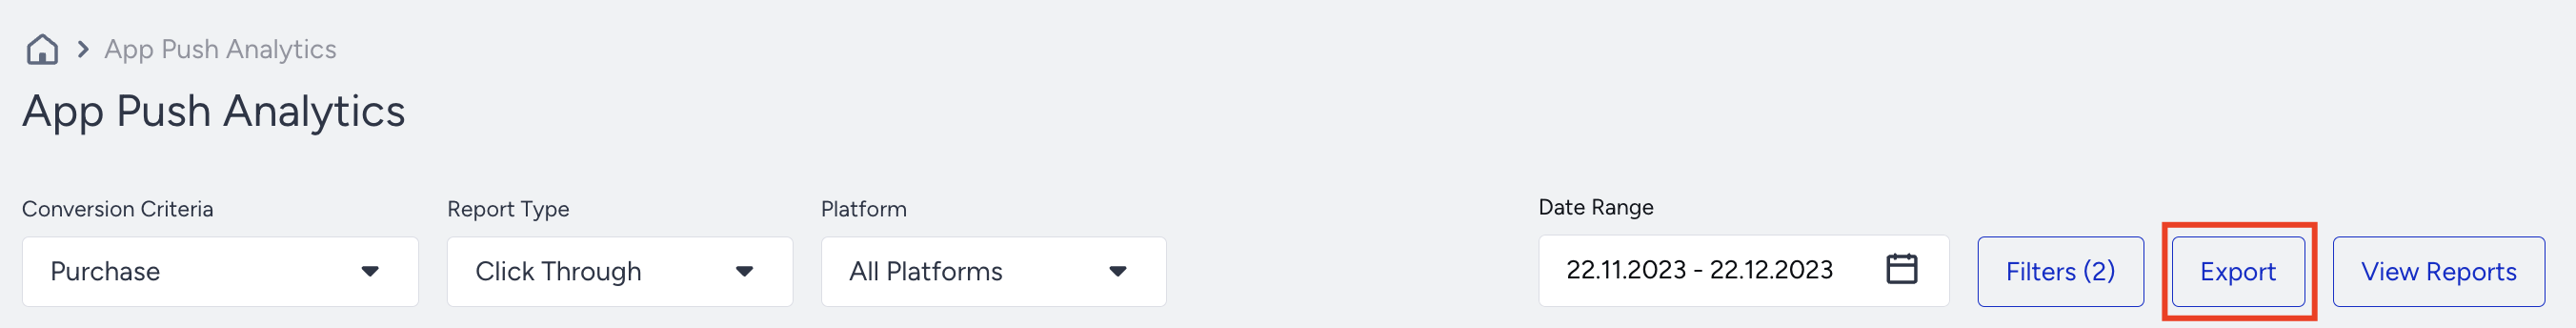
2. You will see Single Report and Recurring Report options to create your report. Choose the one you need and proceed.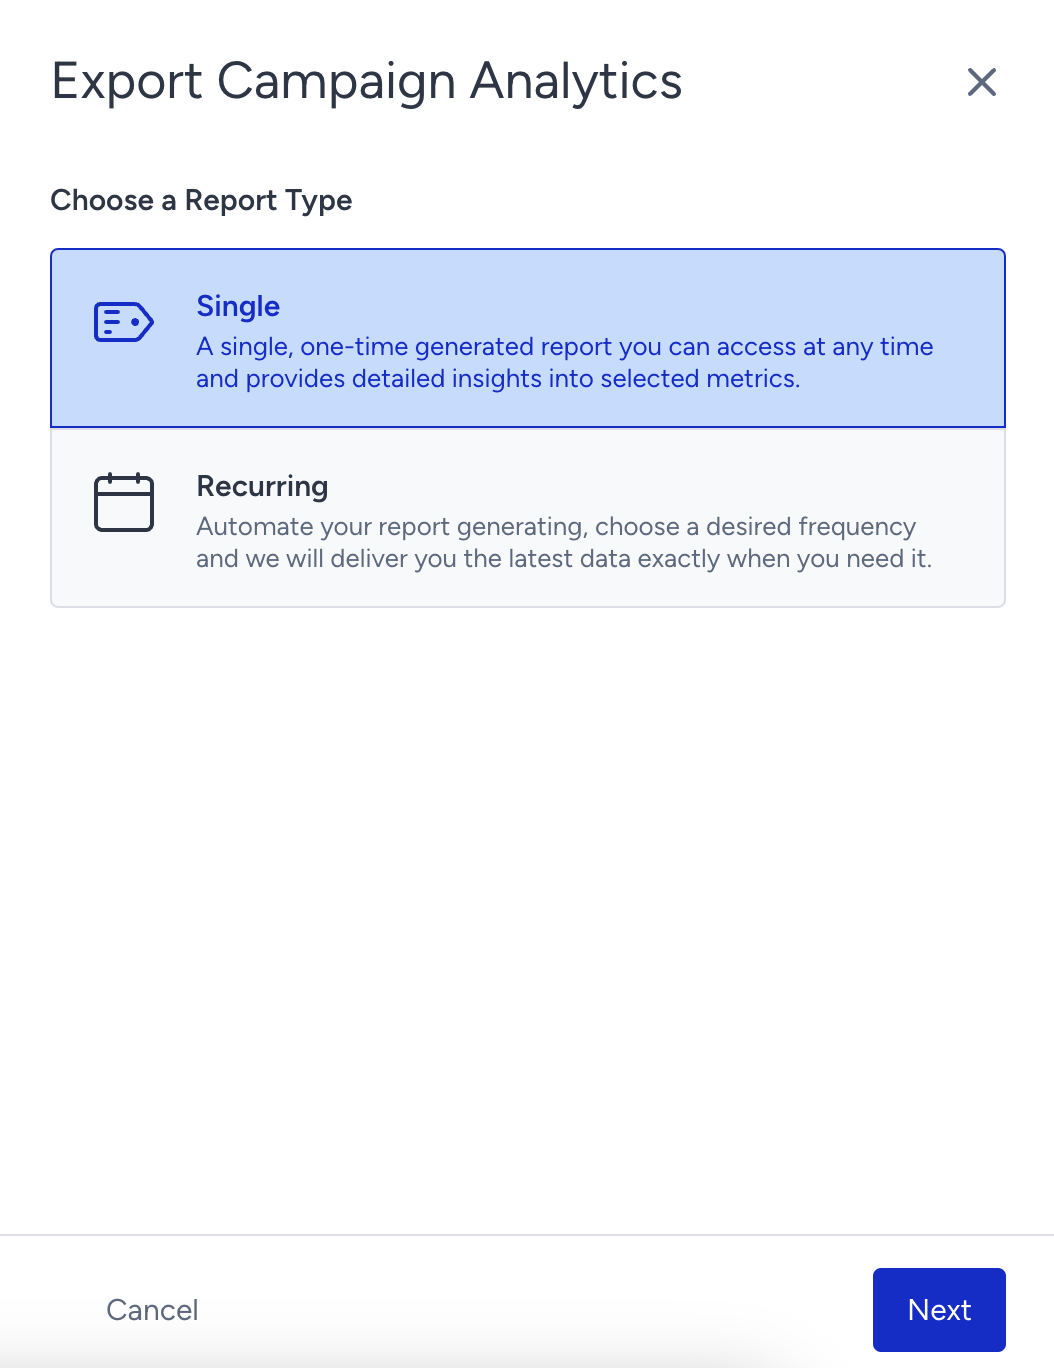
2.1. Single Report is a one-time generated report that you can access any time and it gives you detailed insights about your results based on metrics you selected. You can get your report with or without filters you applied. Click the Create Report button to receive it.  2.2. Recurring Report enables you automate your report creation depending on your desired frequency choice. Therefore, you receive the latest data at the time you need. It is a user-based report. After you configure the recurrence and range settings, click the Create Report button.
Summary Metrics
You can see the summary metrics above the graphs. These metrics are the most important metrics for your app push campaigns, and help you get an overall idea about your campaigns.
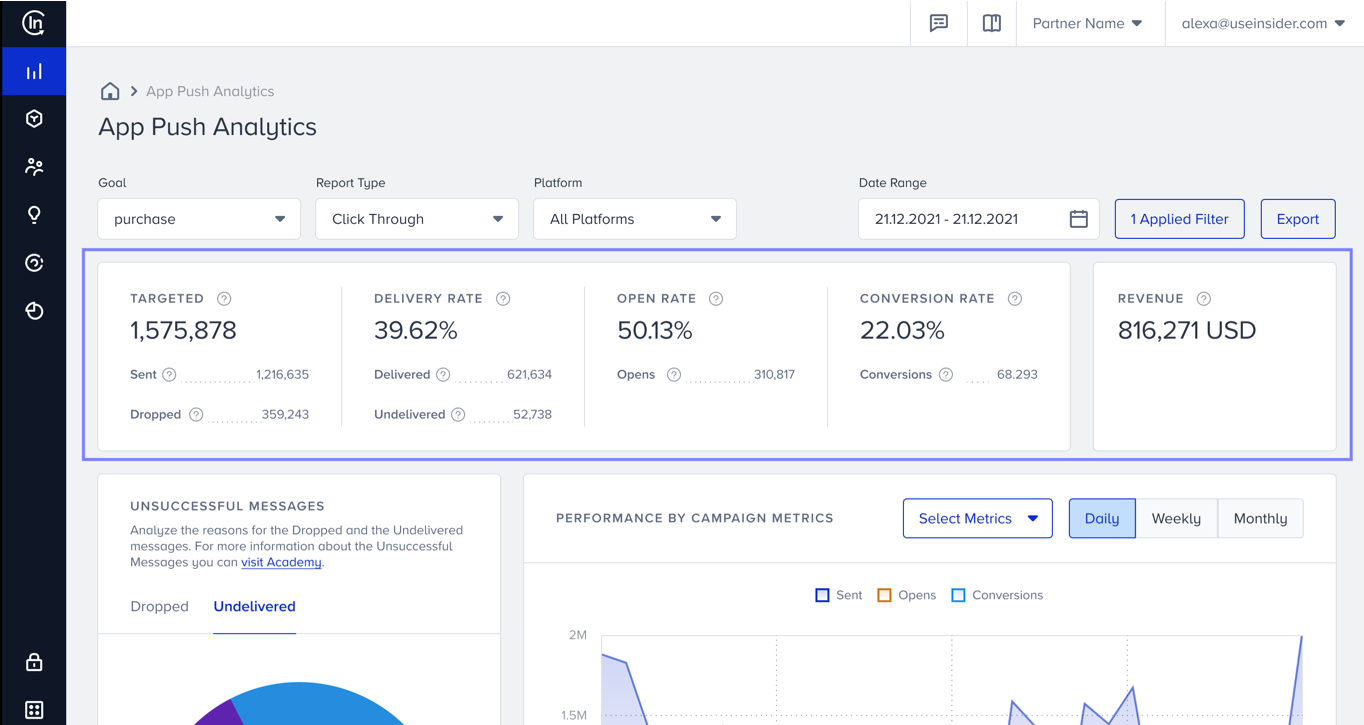
Summary metrics are Targeted, Delivery Rate, Open Rate, Conversion Rate, and Revenue.
- Targeted: The number of recipients in your target audience generated based on the segmentation of your campaigns. Targeted is the sum of Sent and Dropped.
- Sent: The number of app push messages successfully transferred to the service provide to be addressed to the recipients. Sent is the sum of Delivered and Undelivered messages.
- Dropped: The number of app push messages that were not transferred to the service provider to be addressed to the recipients.
- Delivery Rate: The percentage of the Delivered to the Sent app push messages. Delivery Rate is Delivered/Sent.
- Delivered: The number of app push messages successfully transferred to the recipients.
- Undelivered: The number of app push messages that were not addressed to the recipients by the service provider.
- Open Rate: The percentage of the Opens to the Delivered app push messages. Open Rate is Opens/Delivered.
- Opens: The number of app push messages opened by the recipients.
- Conversion Rate: The percentage of the Conversions to the Delivered app push messages. Conversion Rate is Conversions/Delivered.
- Conversions: The number of successful goal accomplishments.
- Revenue: The value of purchases made via your app push messages.
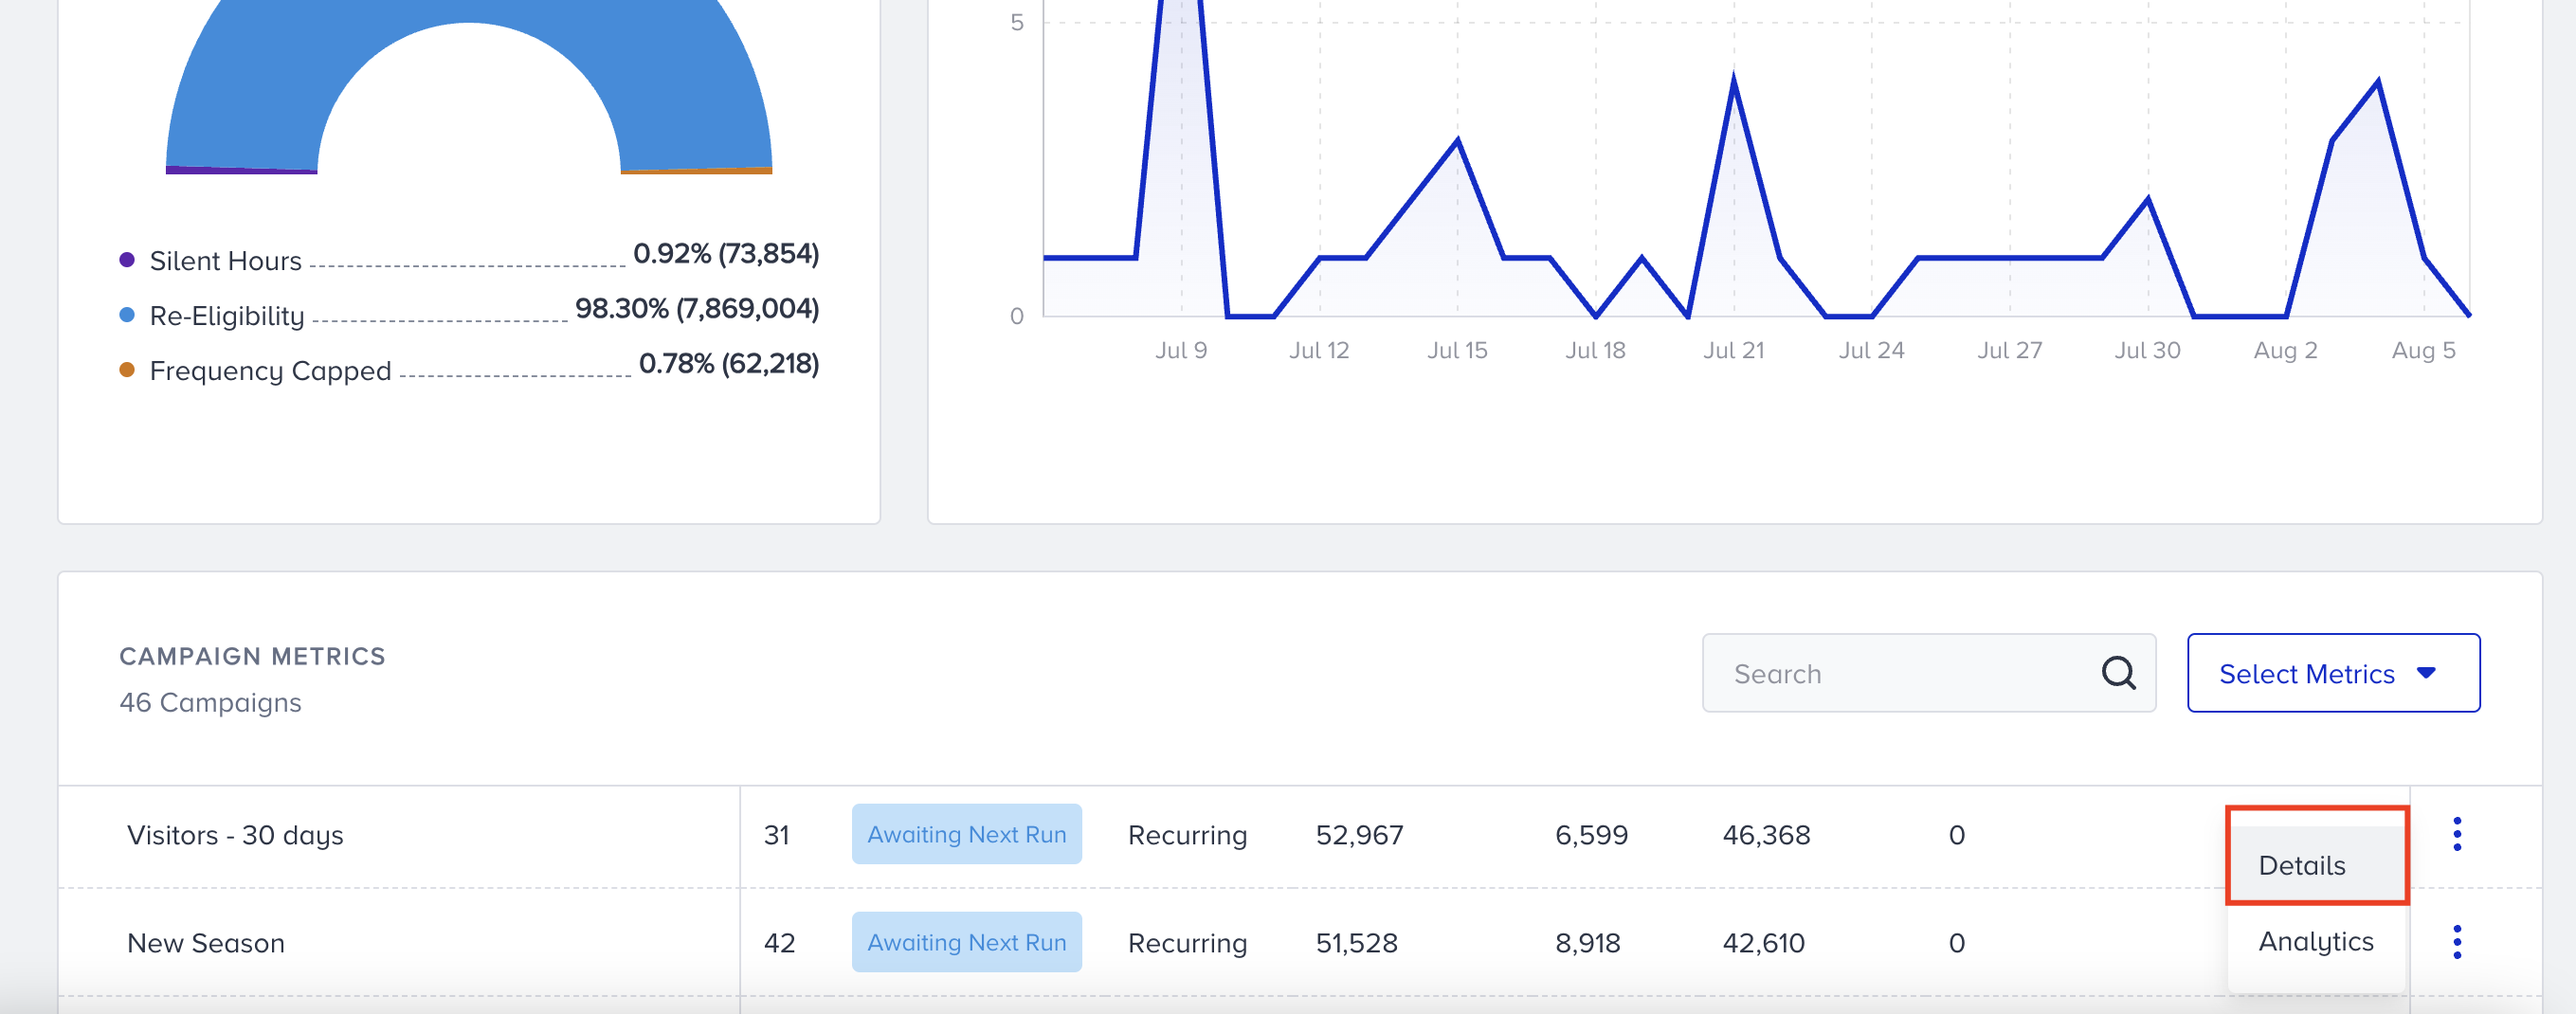
Unsuccessful Messages Pie Chart
This pie chart gives insights about the unsuccessful messages of previously sent app push notifications. The app pushes may not have been delivered due to several reasons. This chart reports these messages with a breakdown of Dropped and Undelivered.

Dropped
There may be 3 reasons for dropped messages:
- Silent Hours: The percentage (and the number) of the Dropped messages due to the Silent Hours settings.
- Re-Eligibility: The percentage (and the number) of the Dropped messages due to the Re-Eligibility settings.
- Frequency Capped: The percentage (and the number) of the Dropped messages due to the Channel Frequency Capping settings.
Undelivered
There may be 2 reasons for undelivered messages:
- Device Uninstalls: The percentage (and the number) of the Undelivered messages due to the recipients who uninstalled your app from their devices.
- Delivery Issues: The percentage (and the number) of Undelivered messages due to various errors on recipients’ devices.
MissingRegistrationStatus // Check that the request contains a registration token (in the registration_id in a plain text message, or in the to or registration_ids field in JSON
InvalidRegistrationStatus // Registration token does not match the registration token the client app receives from registering with FCM.
NotRegisteredStatus // Unregistered means the user deleted the app. On Android 8 and higher, each installation generates a new identifier/token. You may need to add your device to test devices again.
InvalidPackageNameStatus // Make sure the message was addressed to a registration token whose package name matches the value passed in the request.
AuthenticationErrorStatus // The sender account could not be authenticated. Could be due to: missing header or with invalid syntax in HTTP request, Invalid project number, disabled FCM service, Server Key IP whitelist problem.
MismatchSenderIDStatus // Sender ID does not match the registered Sender ID on FCM.
InternalServerErrorStatus // The server encountered an error while trying to process the request.
PayloadEmptyStatus // The message payload was empty.
PayloadTooLargeStatus // The message payload was too large. The maximum payload size is 4096 bytes.
BadTopicStatus // The apns-topic was invalid.
TopicDisallowedStatus // Pushing to this topic is not allowed.
BadMessageIDStatus // The apns-id value is bad.
BadExpirationDateStatus // The apns-expiration value is bad.
BadPriorityStatus // The apns-priority value is bad.
MissingDeviceTokenStatus // The device token is not specified in the request
CertificateIssueStatus // Your APNS certificate is either corrupted or do not exist
BadDeviceTokenStatus // The specified device token was bad. Verify that the request contains a valid token and that the token matches the environment.
DeviceTokenNotForTopicStatus // The device token does not match the specified topic.
UnregisteredStatus // Unregistered means the user deleted the app. On iOS, each installation generates a new identifier/token. You may need to add your device to test devices again.
DuplicateHeadersStatus // One or more headers were repeated.
BadCertificateEnvironmentStatus // The client certificate was for the wrong environment.
BadCertificateStatus // The certificate was bad.
ForbiddenStatus // The specified action is not allowed.
TooManyRequestsStatus // Too many requests were made consecutively to the same device token.
IdleTimeoutStatus // Idle time out.
MissingTopicStatus // The apns-topic header of the request was not specified and was required. The apns-topic header is mandatory when the client is connected using a certificate that supports multiple topics.
NoDeviceTokenStatus // User did not allow push notification.
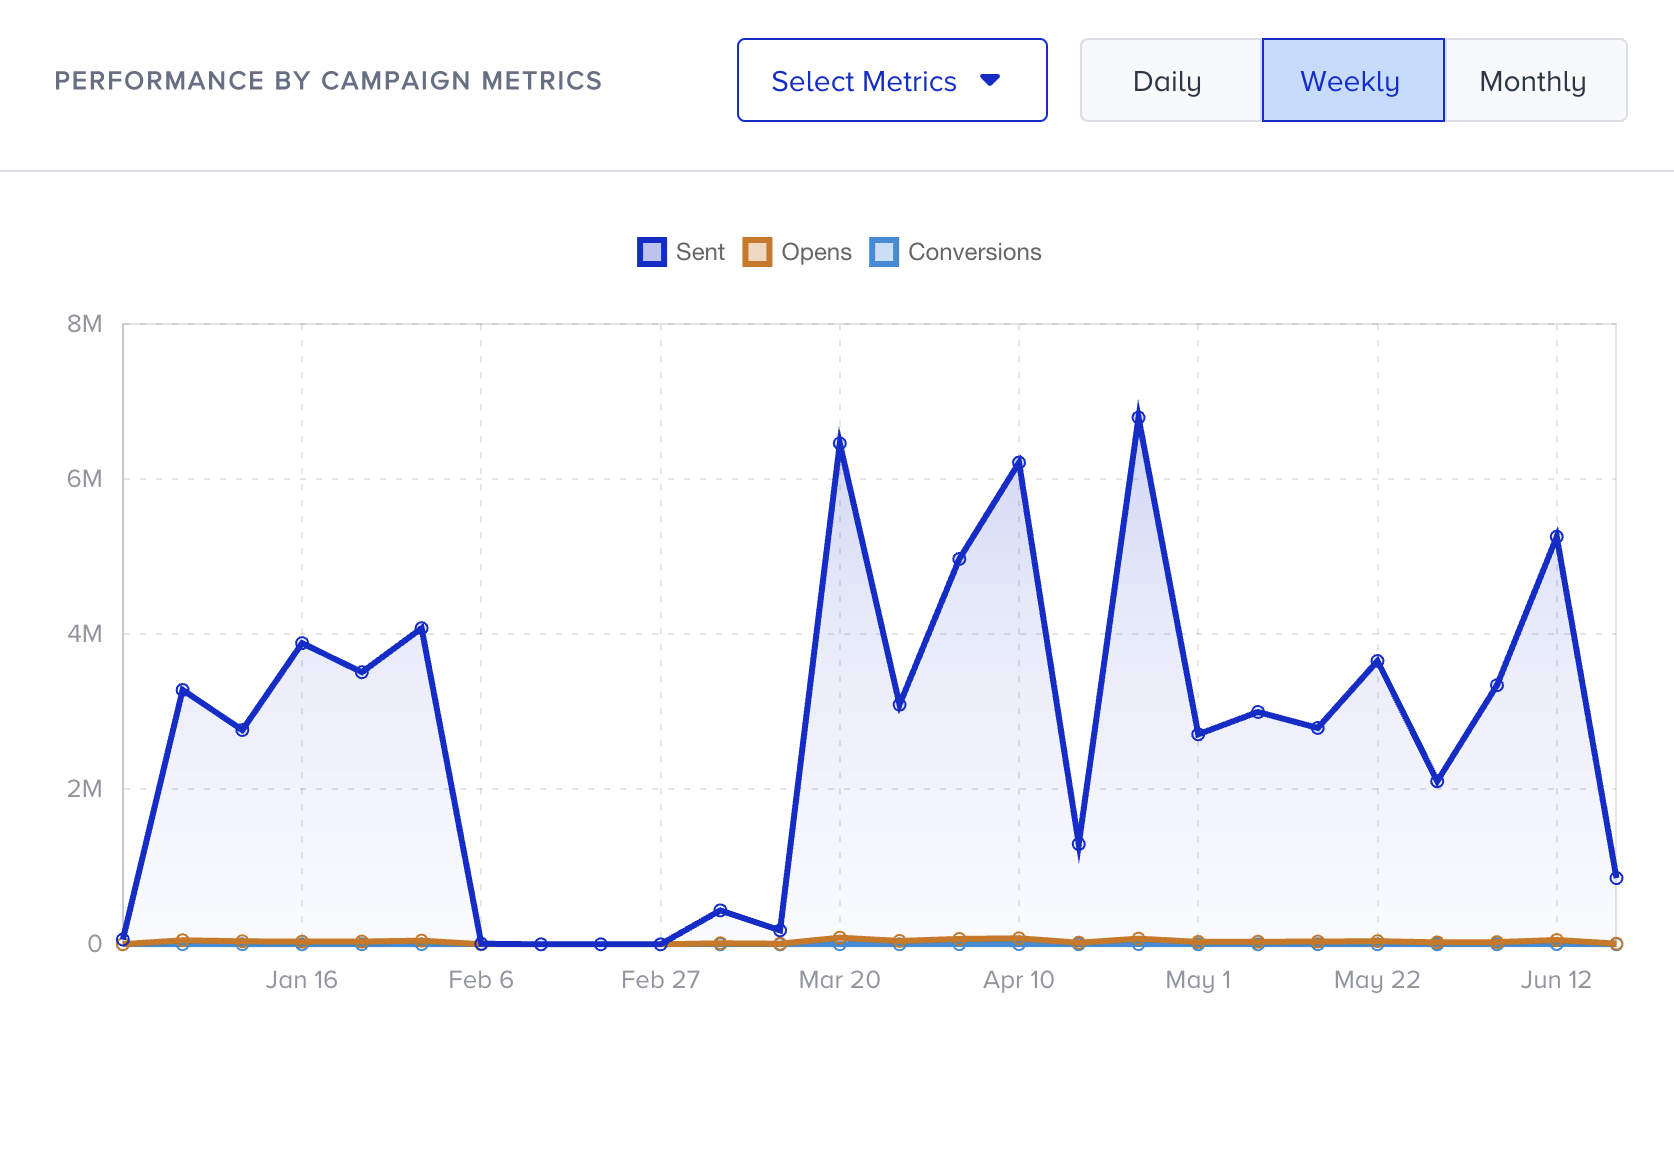
NoGDPRConsentStatus // Please make sure the GDPR value is 'true' for the userPerformance by Campaign Metrics Graph
You can view the Sent, Opens, and Conversions summary metrics of your campaigns on a daily, weekly, or monthly basis based on your date range. This graph helps you see the change of these metrics over time.
Campaign Metrics Data Table
The campaigns data table displays all campaigns with detailed metrics. The listed campaigns may vary depending on the filters, date range, and selected goal.
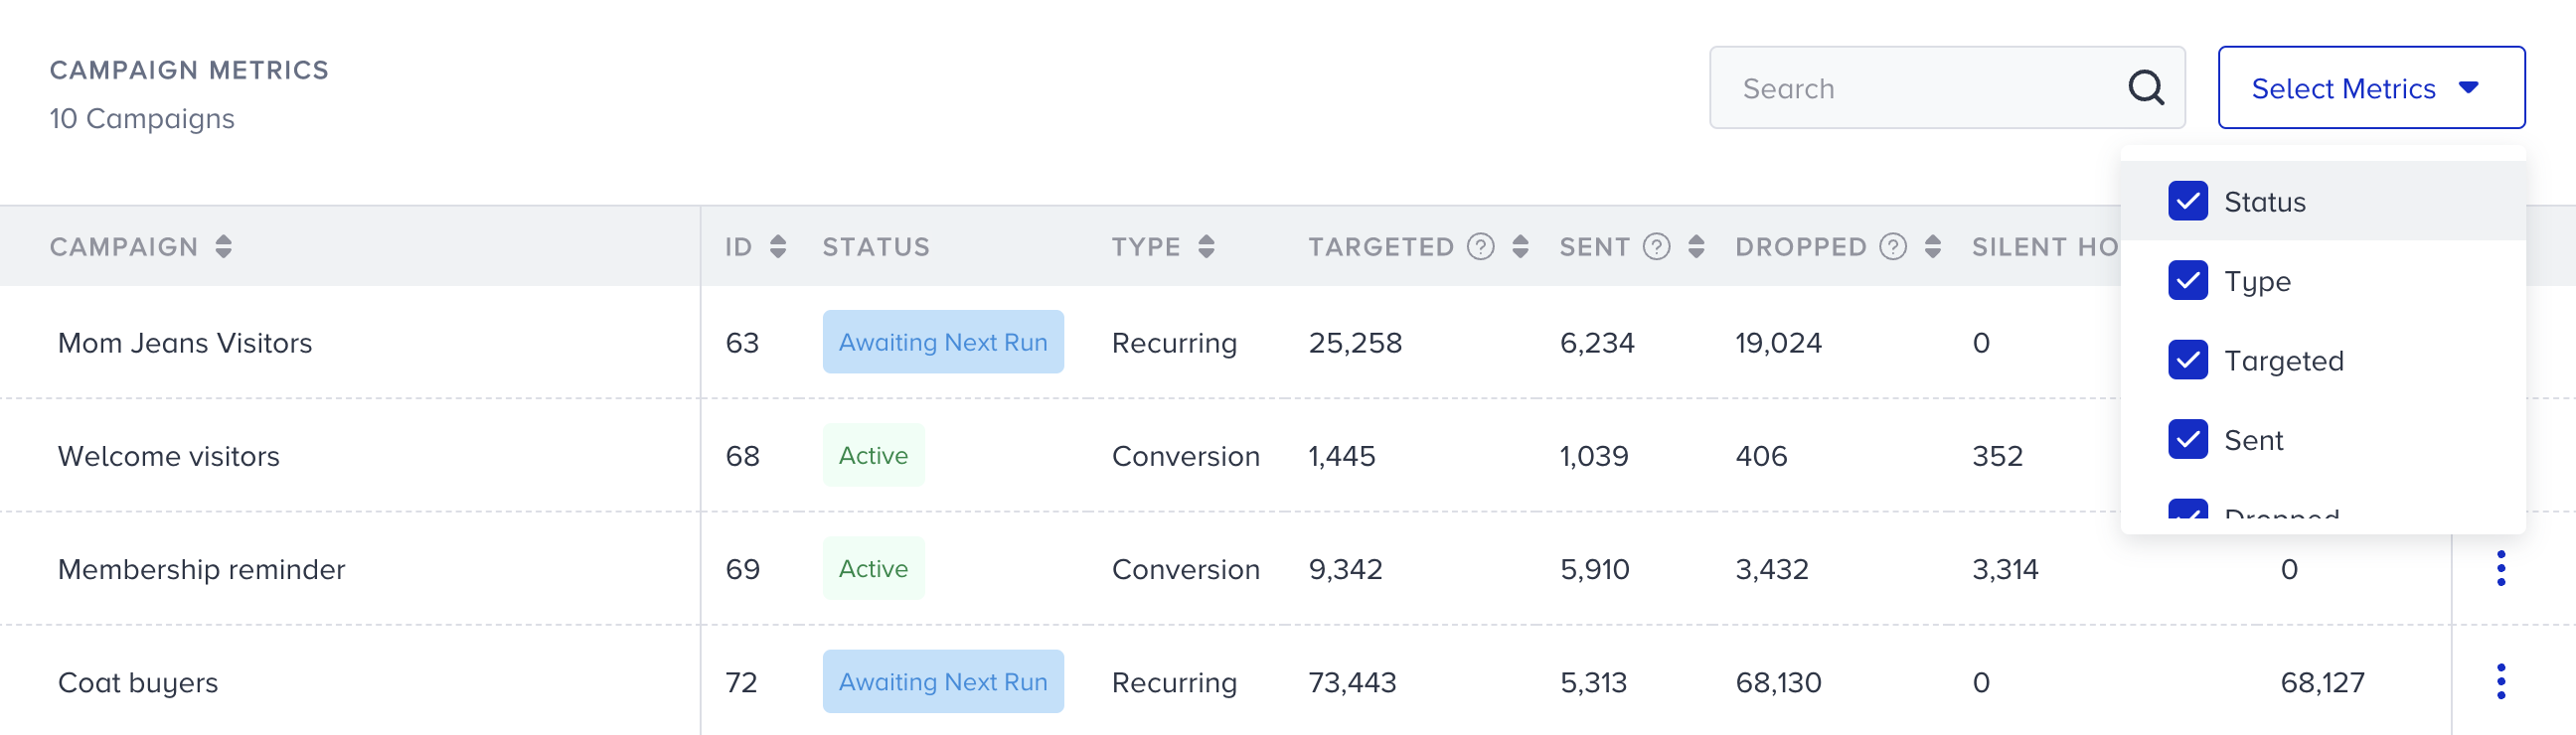
This table provides the following metrics:
- Campaign: Campaign names listed in the table.
- ID: ID of the listed campaign.
- Status: Status of the listed app push campaign. The status can be one of these options: Completed, Active, Passive, Awaiting Next Run, Running, Scheduled, and Stopped.
- Type: Type of the listed app push campaign. The type can be one of these options: Single, Carousel, Slider, Discovery, Recurring, Conversion, Geofence, or Cart Reminder.
- Targeted: The number of recipients in your target audience generated based on the segmentation of your campaign.
- Sent: The number of app push messages successfully transferred to the service provider to be addressed to the recipients.
- Dropped: The number of app push messages that were not transferred to the service provider to be addressed to the recipients.
- Re-eligibility: The percentage (and the number) of the Dropped messages due to the Re-Eligibility settings.
- Silent Hours: The percentage (and the number) of the Dropped messages due to the Silent Hours settings.
- Delivery Rate: The percentage of the Delivered to the Sent App Push messages.
- Delivered: The number of app push messages successfully transferred to the recipients.
- Undelivered: The number of app push messages that were not addressed to the recipients by the service provider.
- Delivery Issues: The percentage (and the number) of Undelivered messages due to various errors on recipients’ devices.
- Device Uninstalls: The percentage (and the number) of Undelivered messages due to the recipients who uninstalled your app from their devices.
- Open Rate: The percentage of the Opens to the Delivered App Push messages.
- Opens: The number of app push messages opened by the recipients.
- Conversion Rate: The percentage of the Conversions to the Delivered App Push messages.
- Conversions: The number of successful goal accomplishments.
- Revenue: The value of purchases made via your App Push messages.
- Primary Goals: The goal selected as the primary goal for the app push campaign.
- Segment: The segment used in the app push campaign.
- Rule: The rule set used in the app push campaign.
- Starts On: The start date of the campaign.
- Ends On: The end date of the campaign.
- Tags: Tags used in the app push campaign.
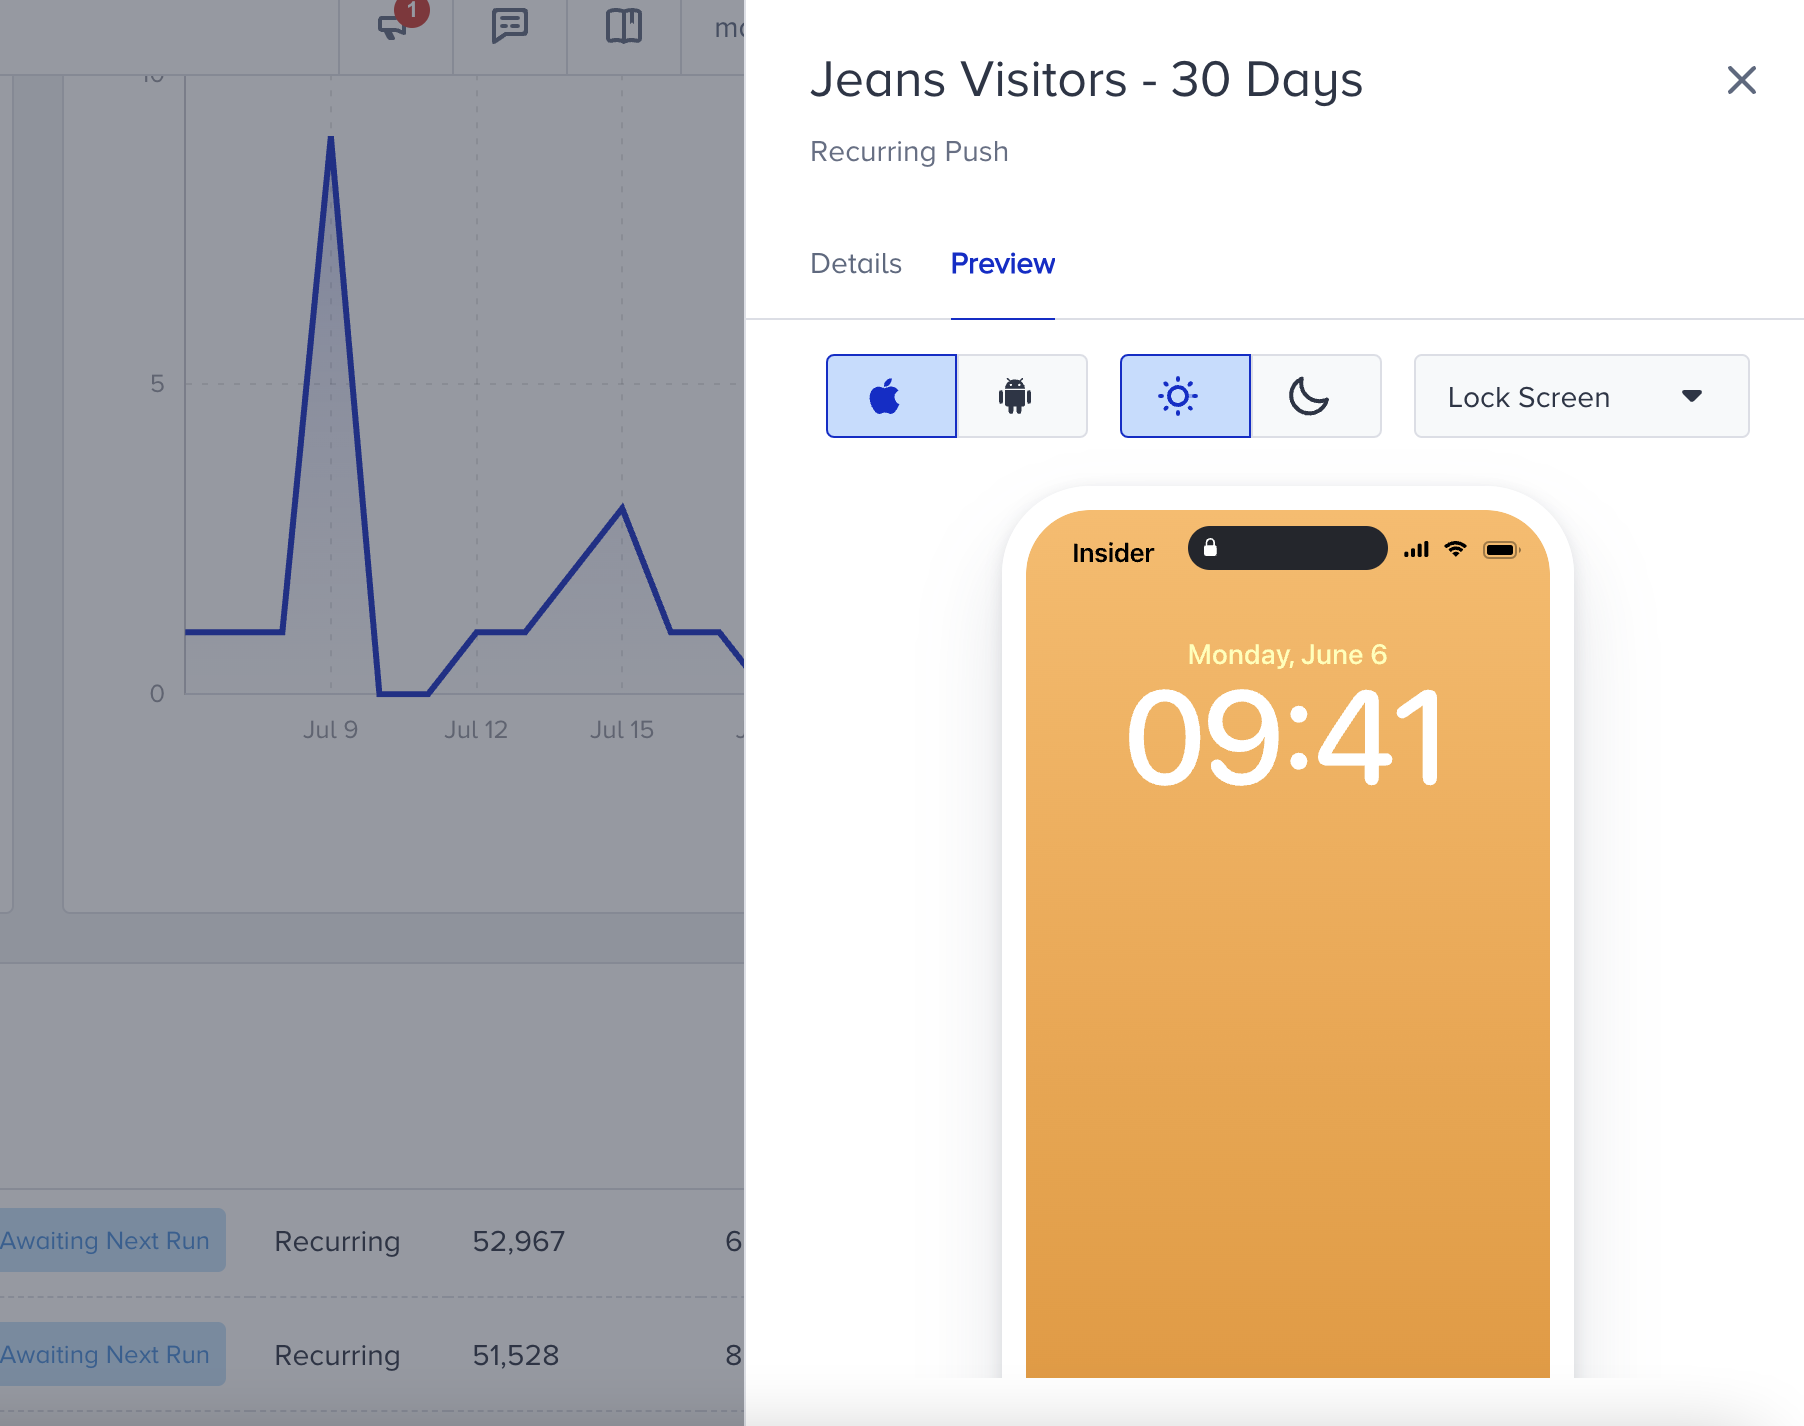
To view the details and preview of your app push campaigns, click the menu against the campaign and the Details button.
The first tab displays the details of your push campaign while the second tab displays the preview.
Was this article helpful?