Architect Journey: On-Site Channel Analytics
- 21 Nov 2023
- 2 Minutes to read
Architect Journey: On-Site Channel Analytics
- Updated on 21 Nov 2023
- 2 Minutes to read
Article Summary
Share feedback
Thanks for sharing your feedback!
When you are at the On-Site element on the canvas, you can click Go to On-Site Analytics button on the element to see the statistics of this channel.

To filter the on-site metrics, you can:
- Select a platform to evaluate your on-site metrics using the dropdown on the top left corner of the page,Your title goes hereAll Platforms option comes selected by default. You can proceed with selecting the one you wish.
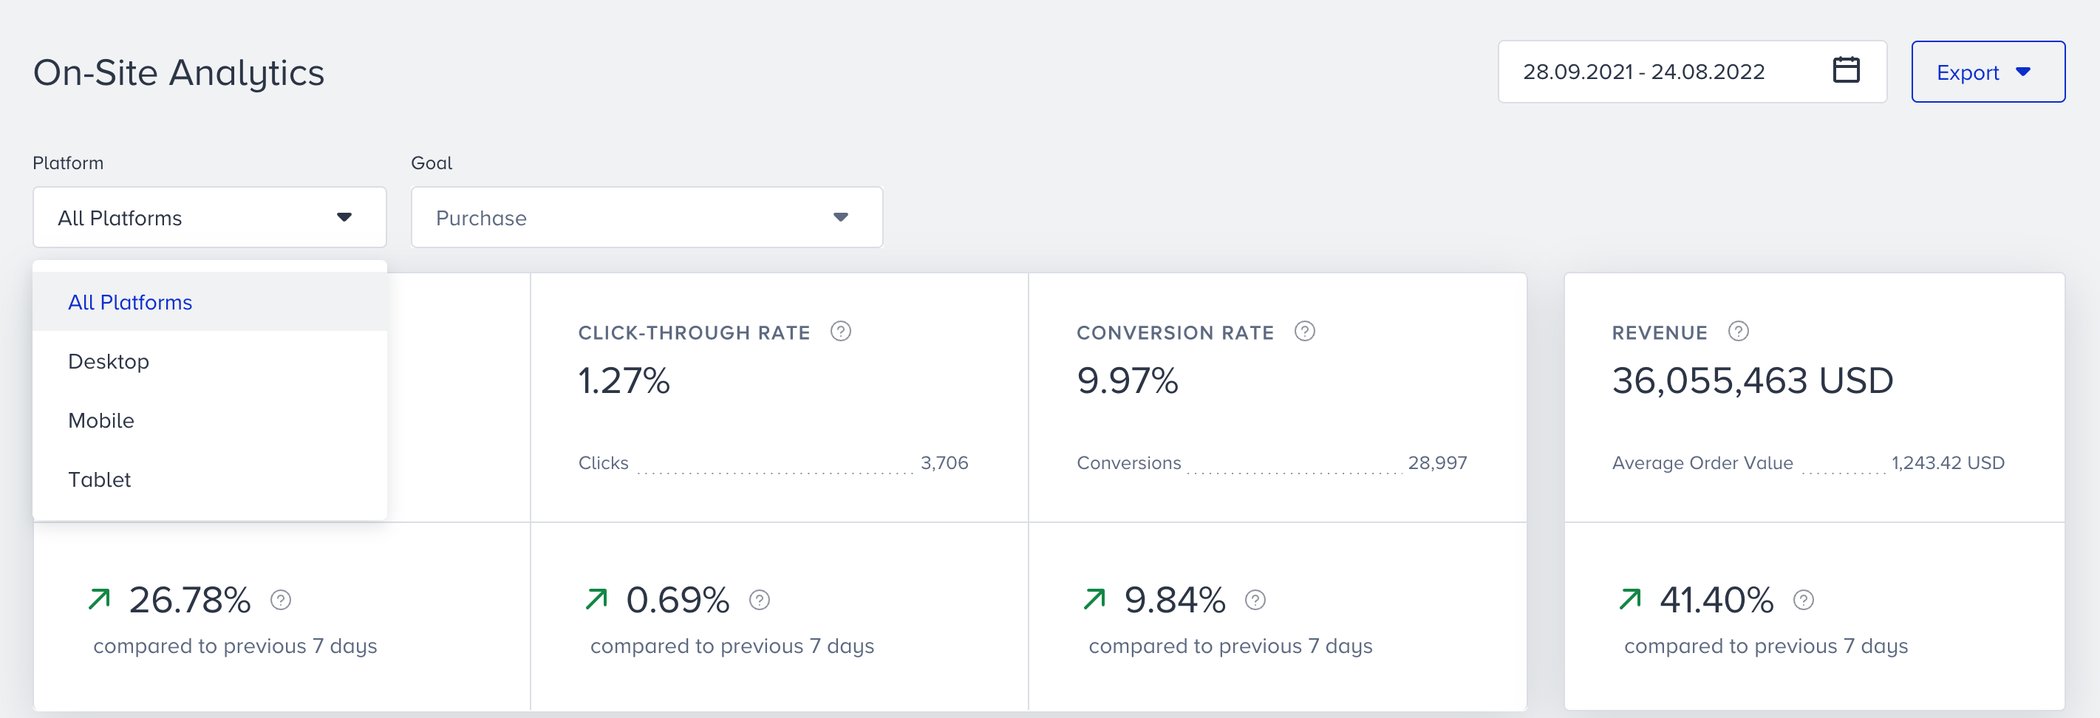
- Select a goal to evaluate your on-site conversion and conversion rate metrics using the dropdown on the top left corner of the page,

your title goes here
Purchase is the default goal set on your account. You can set goals on the top bar of the canvas when creating your journey. Read more on Set Goals.
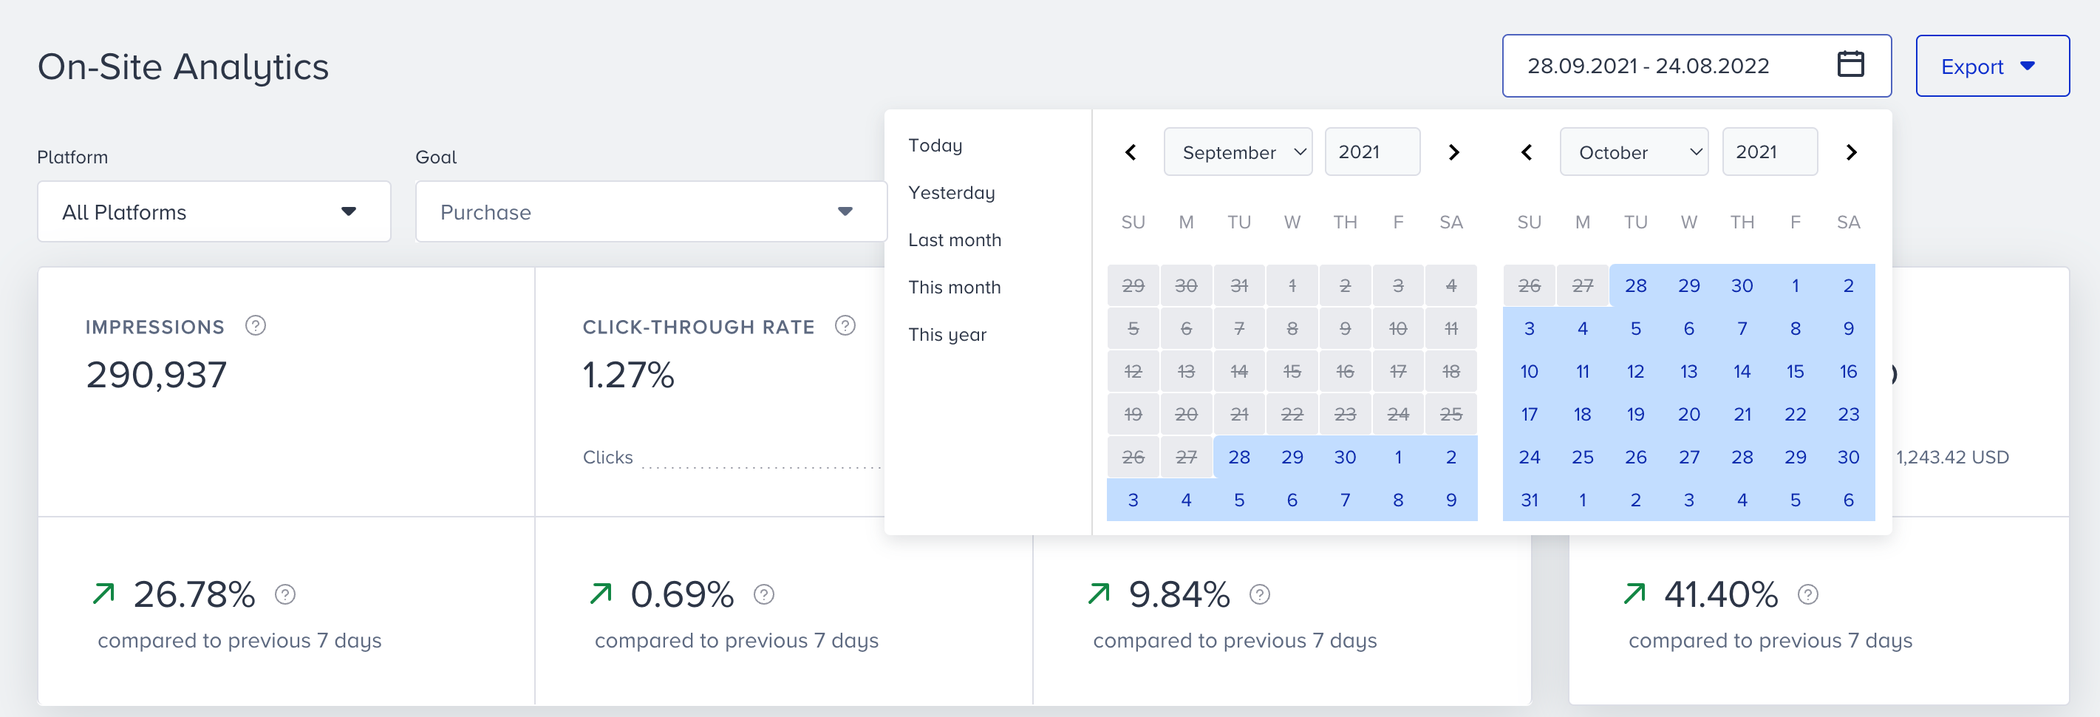
- Select a time range using the date picker on the top right corner of the page.

You can also export your report in Excel format by clicking the Export button and selecting Export On-Site Analytics. You can export the results of your On-Site lead collection, survey, or feedback campaigns by selecting the Export Results option. 
You can select the date range, the platform on which the campaign is shown, and the export file type to download the results of your campaign.
If you are using a cross-platform template, you will not see the platform selection while exporting the results.
Narrowing down your results, you can see the following metrics:
You can see the incremental or decremental changes in impressions, click-through rate, conversion rate, and revenue based on the selected date range. For example, when you select "last month", it will compare the last month to the previous month. When you select 7 days on the date picker, it will compare the selected 7 days to the previous 7 days.
- Impressions: The number of On-Site campaigns shown to the users.
- Clickthrough rate: The percentage of times that the users interacted with the campaign to the shown campaign via On-Site.
- Clicks: The number of times that the users interacted with On-Site.
- Conversion rate: The percentage of the successful goal accomplishments to the shown campaign via On-Site.
- Conversions: The number of successful goal accomplishments via On-Site. Conversion changes according to Conversion Goal selection on the dropdown.
your title goes here
Conversion goal duration settings affect the conversion and revenue metrics of your campaigns. For example, the conversion goal duration of your campaign is 1 hour. You see this campaign, but do not make a purchase within the next hour. In this case, no conversion or revenue is displayed on the stats for this campaign.
- Revenue: The total value of the purchases made via On-Site.
- Average Order Value: The division of revenue by the number of purchases made via On-Site.

The charts section displays the daily, weekly or monthly details on a line chart based your time range selection, and the metric that you can select using the dropdown on the top left corner of this section. You can also select Impressions, Clicks or Conversions.
.png)
The last section of this page allows you to view the performance of your on-site campaign based on device types. It can give your helpful insights about the volume of the platforms.
Was this article helpful?