Architect Journey: Email Channel Analytics
- 10 May 2024
- 3 Minutes to read
Architect Journey: Email Channel Analytics
- Updated on 10 May 2024
- 3 Minutes to read
Article Summary
Share feedback
Thanks for sharing your feedback!
Suggested readings: Architect Channel Email, Using Email, Architect Email Analytics, Email Metrics
When you are at the Email element on the canvas, you can click the Go to Analytics button on the element to see the analytics of this channel.
To filter the email metrics, you can:
- Select a goal to evaluate your email conversions and conversion rate metrics via the dropdown on the top left corner of the page,
your title goes here
Purchase is the default goal set on your account. You can set goals on the top bar of the canvas when creating your journey. Read more on Set Goals.
- Select a time range using the date picker on the top right corner of the page.
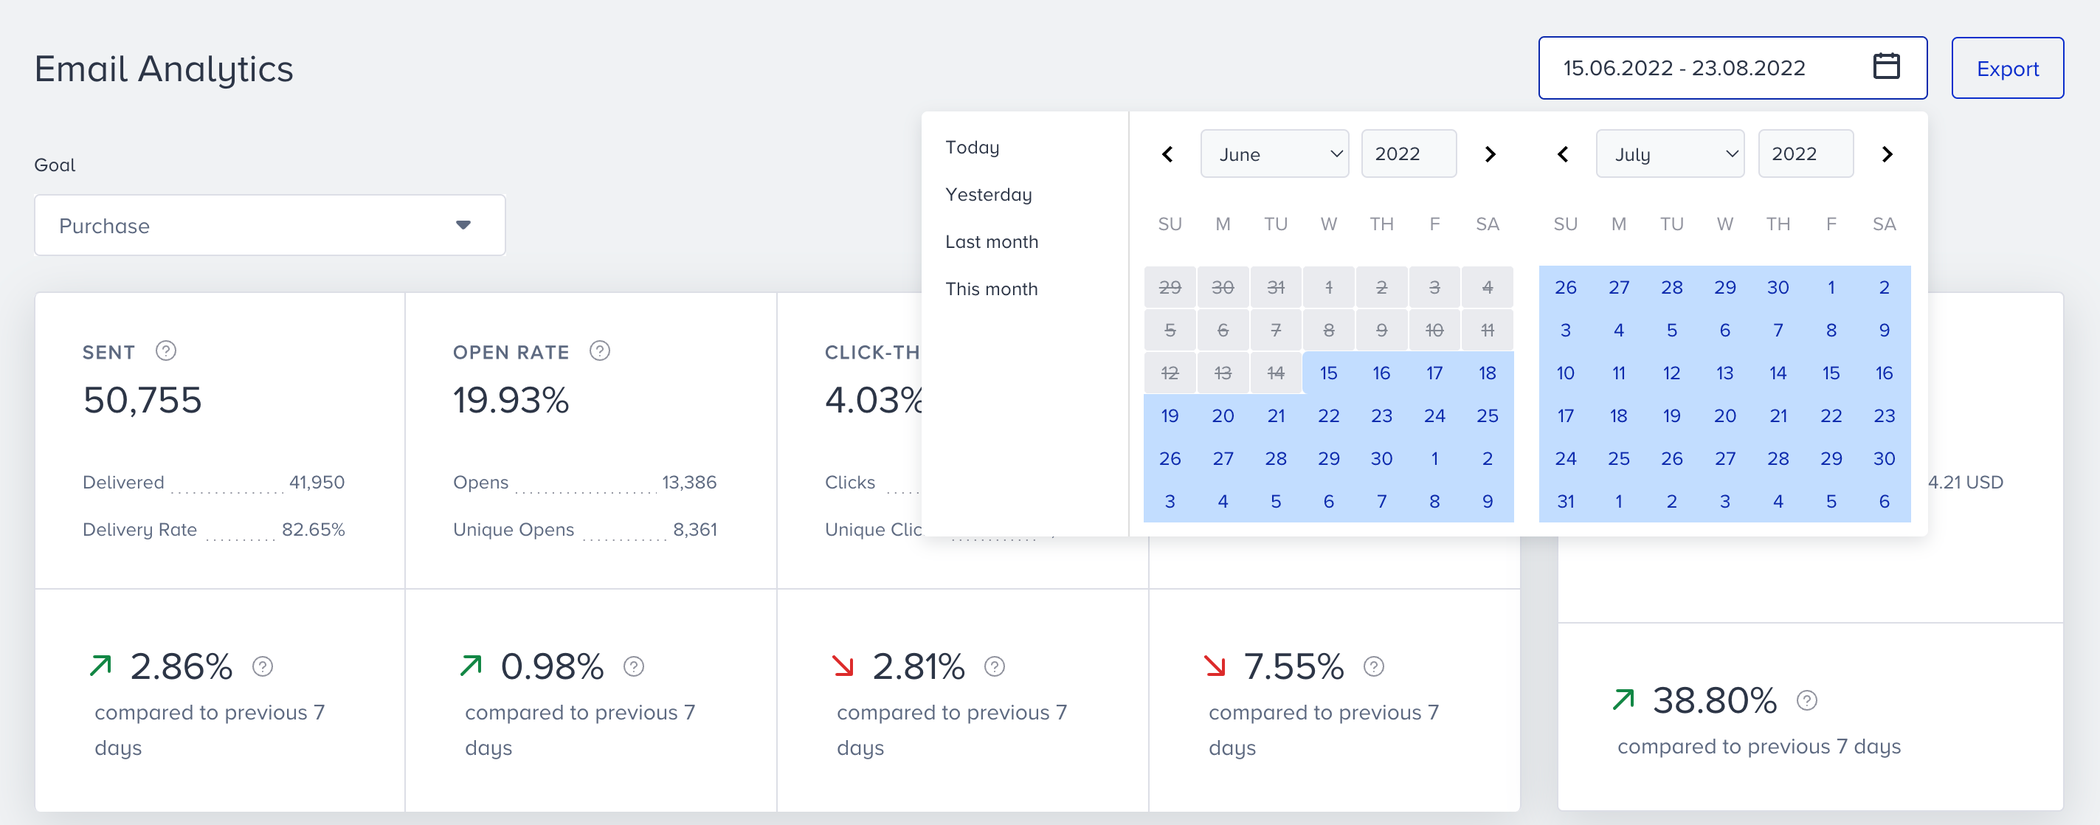

You can also click the Export button to export your report in Excel format.
If you have an AMP form in your email design, you can collect answers from users and export them as well. In the settings panel, choose the predefined service for data collection. Once you choose it, the replies on the feedback form will be saved. Later on, you can export the form responses from the Channel Analytics page.
You can also click the Export > Form Responses button to export your report in Excel format.
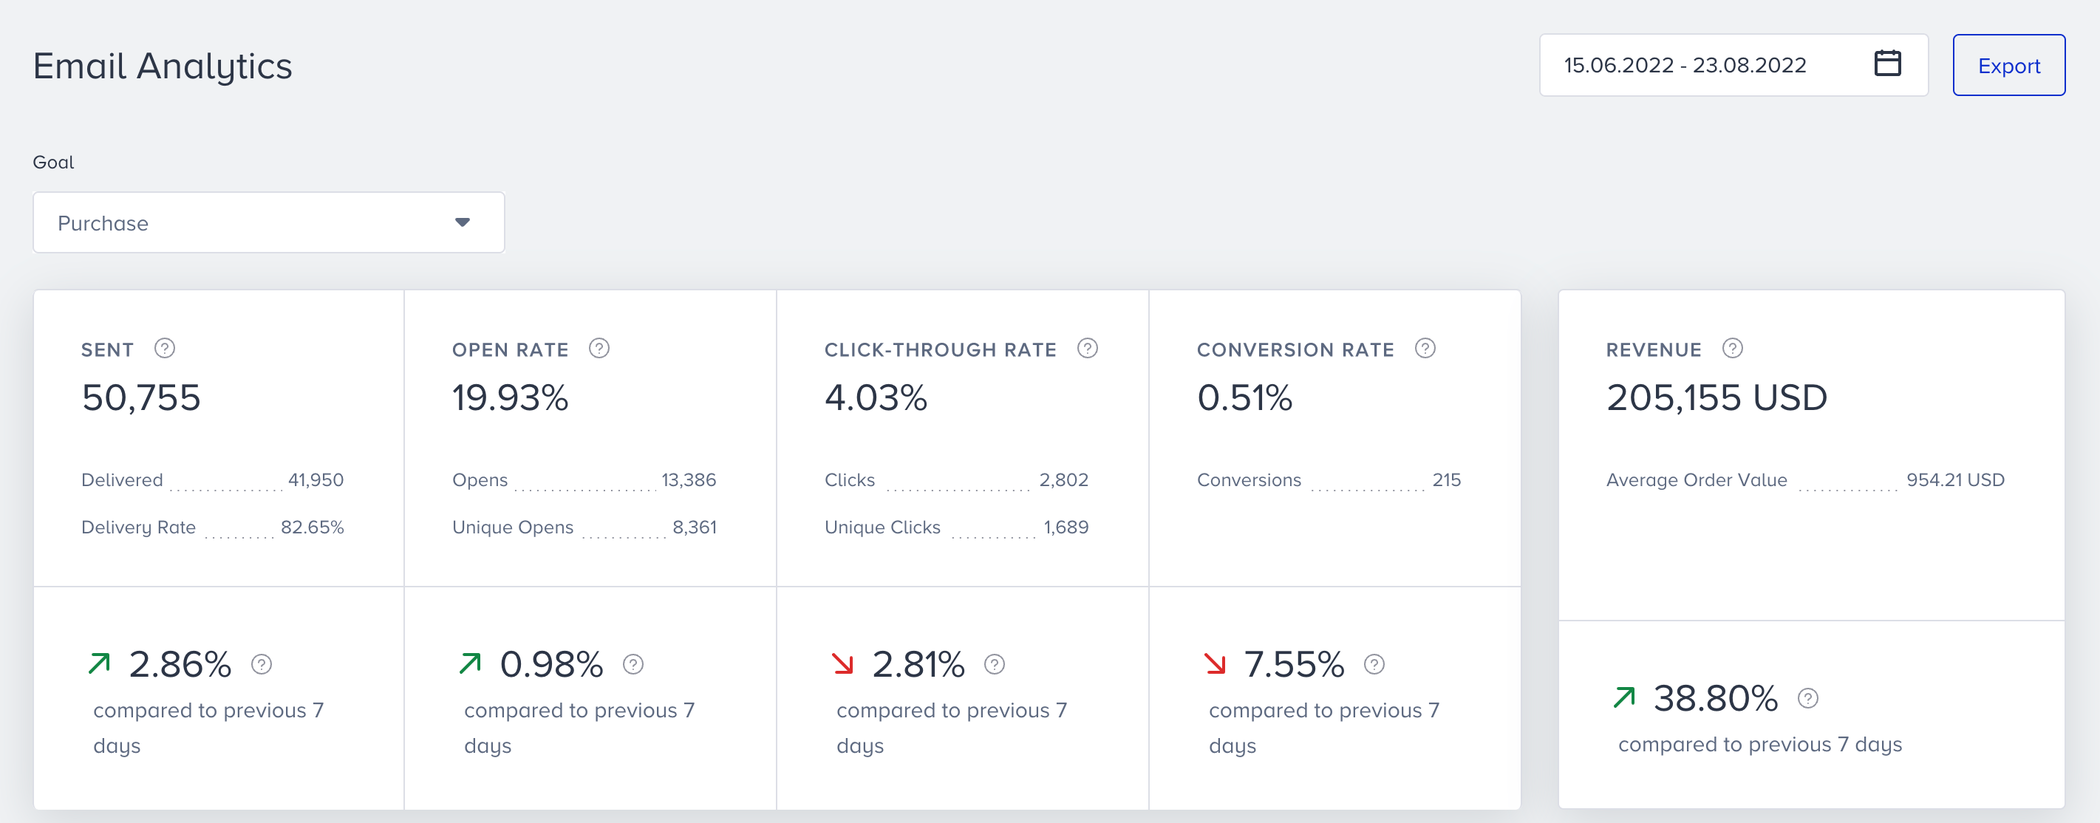
Narrowing down your results, you can see the following metrics:
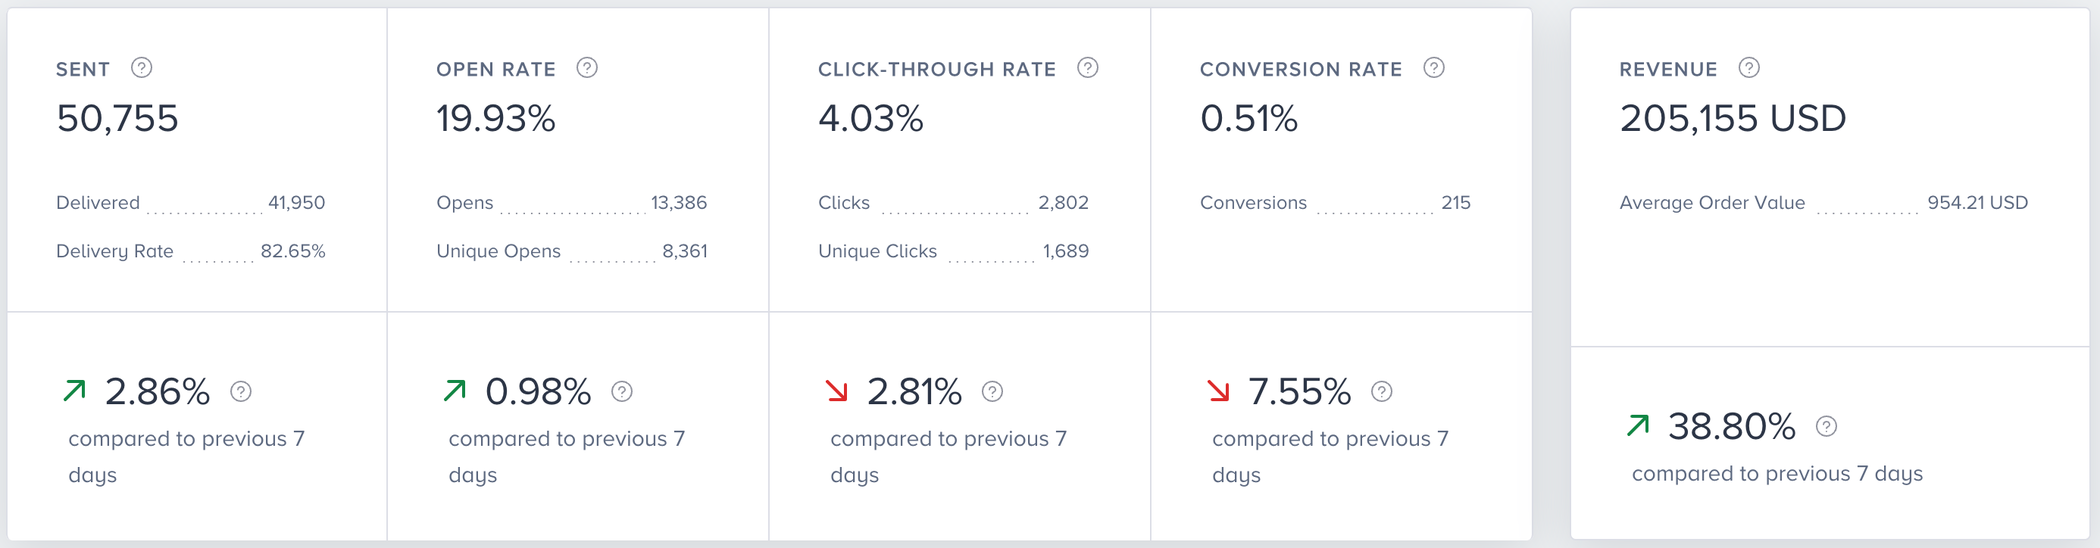
You can see the incremental or decremental changes in sent, open rate, click-through rate, conversion rate, and revenue based on the selected date range. For example, when you select "last month", it will compare the last month to the previous month. When you select 7 days on the date picker, it will compare the selected 7 days to the previous 7 days.
Your title goes here
Since only the prior data of 6 months to be compared is available, you can select a period of time up to 6 months.
- Sent: The number of emails addressed to the users.
- Delivered: The number of emails delivered to the users.
- Open rate: The percentage of times that the users open the emails to the delivered emails.
- Total opens: The total number of times that the users open the emails. This number demonstrates the number of opens regardless of unique users. This means that if the same user opens the sent email 5 times, this number will increase by 5.
- Unique opens: The number of unique individuals who open your emails. This number demonstrates the number of opens in regards to the uniqueness of users. This means that if the same user opens the sent email 5 times, this number will increase by 1 and not 5.
- Clickthrough rate: The percentage of times that the users click on the URL in the email to the delivered emails.
- Total clicks: The total number of times that the users click on the URL in the email. This number demonstrates the number of clicks regardless of unique users. This means that if the same user clicks on the same item 5 times, this number will increase by 5.
- Unique clicks: The number of unique individuals who click on the URL in the email. This means that if the same user clicks the same link 5 times, this number will increase by 1 and not 5.
your title goes here
Conversion goal duration settings affect the conversions and revenue metrics of your campaigns. For example, the conversion goal duration of your campaign is 1 hour. You see this campaign, but do not make a purchase within the next hour. In this case, no conversion or revenue is displayed on the stats for this campaign.
- Conversion rate: The percentage of the successful goal accomplishments to the delivered emails.
- Conversions: The number of successful goal accomplishments via email. Conversions change according to Conversion Goal selection on the dropdown.
- Revenue: The total value of the purchases made via email.
- Average Order Value: The division of revenue by the number of purchases made via Email.
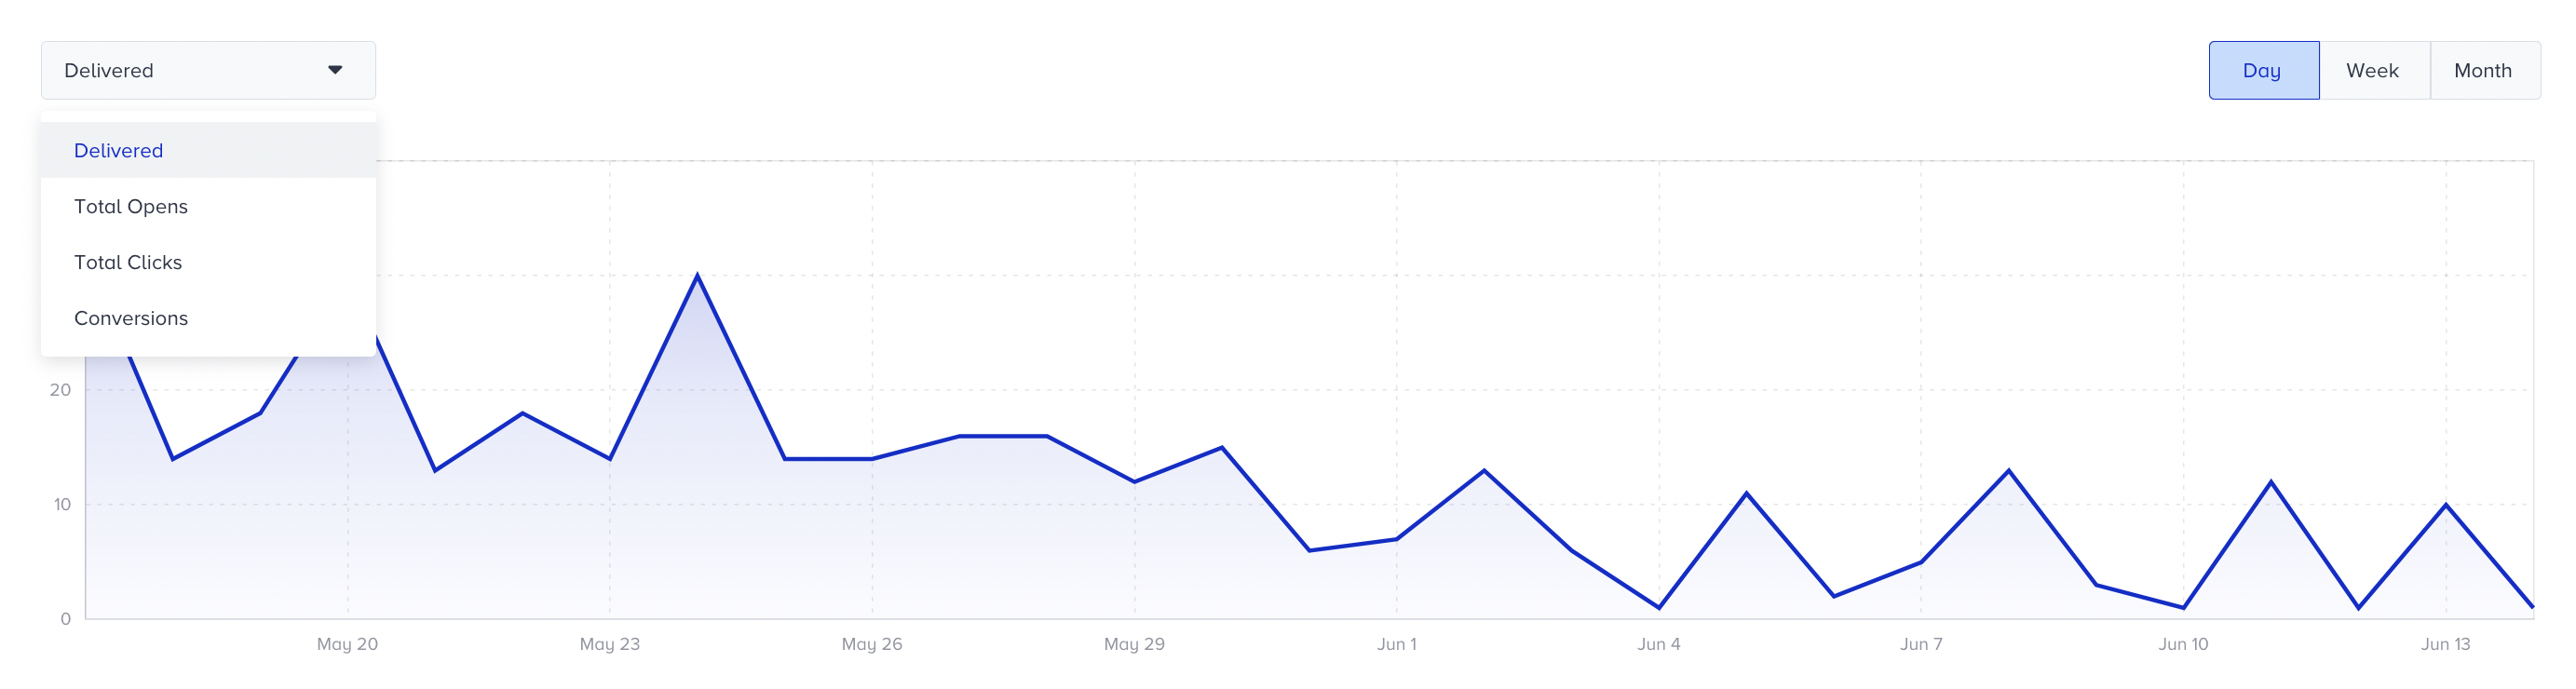
The charts section displays the daily, weekly or monthly details on a line chart based your time range selection, and the metric that you can select using the dropdown on the top left corner of this section. You can also select Delivered, Total Opens, Total Clicks or Conversions.

The last section of this page allows you to view the following email-related details of the campaigns that you send on a specific date range:
- Bounce Rate
- Bounce
- Blocks
- Spam Reports
- Unsubscribers
Refer to Email Metrics for further information on the metrics.
The Link Click Activity allows you to see the total clicks and unique clicks related to the URLs embedded in the emails sent from journeys.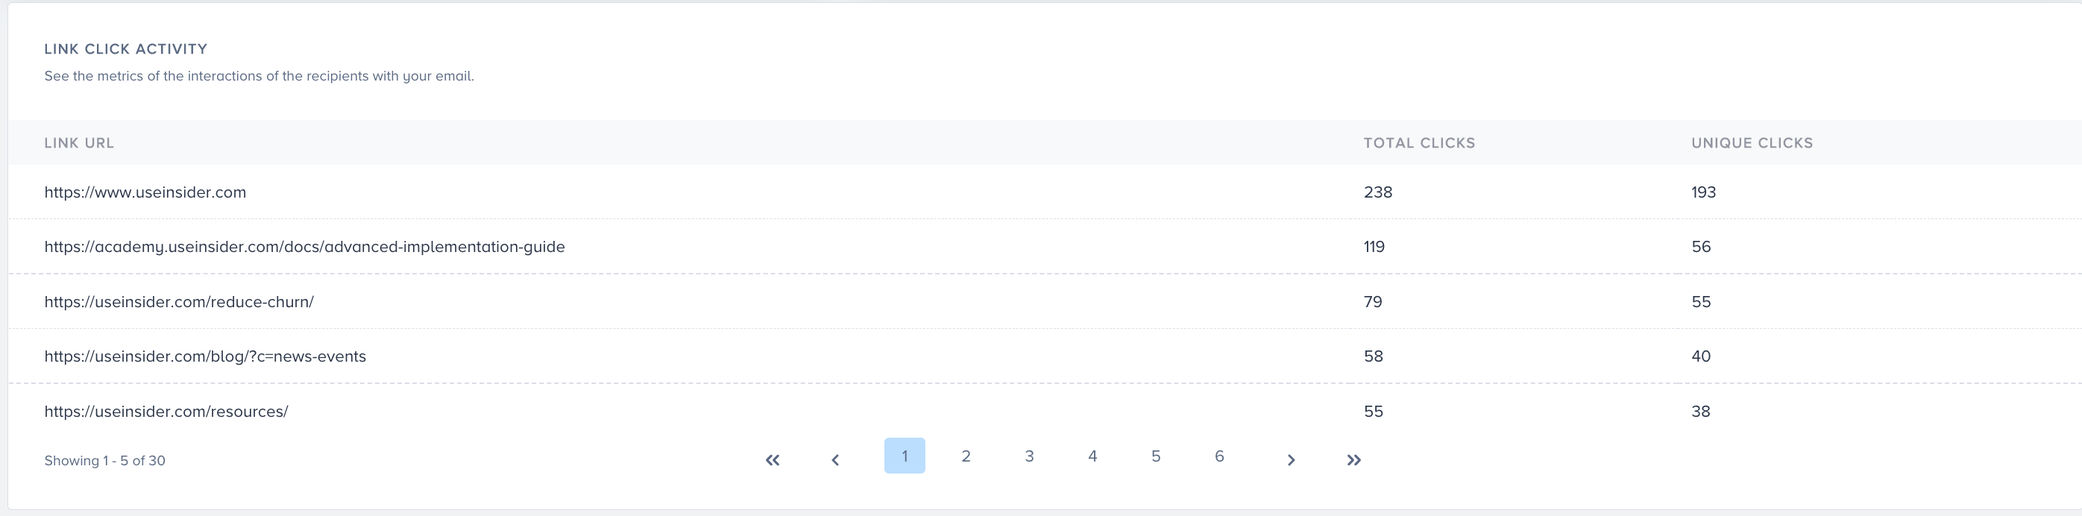
Was this article helpful?