Architect Analytics Dashboard
- 04 Apr 2024
- 7 Minutes to read
Architect Analytics Dashboard
- Updated on 04 Apr 2024
- 7 Minutes to read
Article Summary
Share feedback
Thanks for sharing your feedback!
Architect Analytics dashboard offers a visual report to analyze the performance of all journeys. You can easily navigate to this dashboard through the Analytics tab on the journey listing page.
Analytics Dashboard consists of 6 sections:
- Number of journeys
- Live stats
- Analytics of all journeys
- Performance of channels
- User Reachability
- Performance of journeys
In the right top corner, you can choose a specific time range to view the statistics that belong to the journeys in this time interval.
Your title goes here
You can view data up to 1 year on the analytics dashboard.

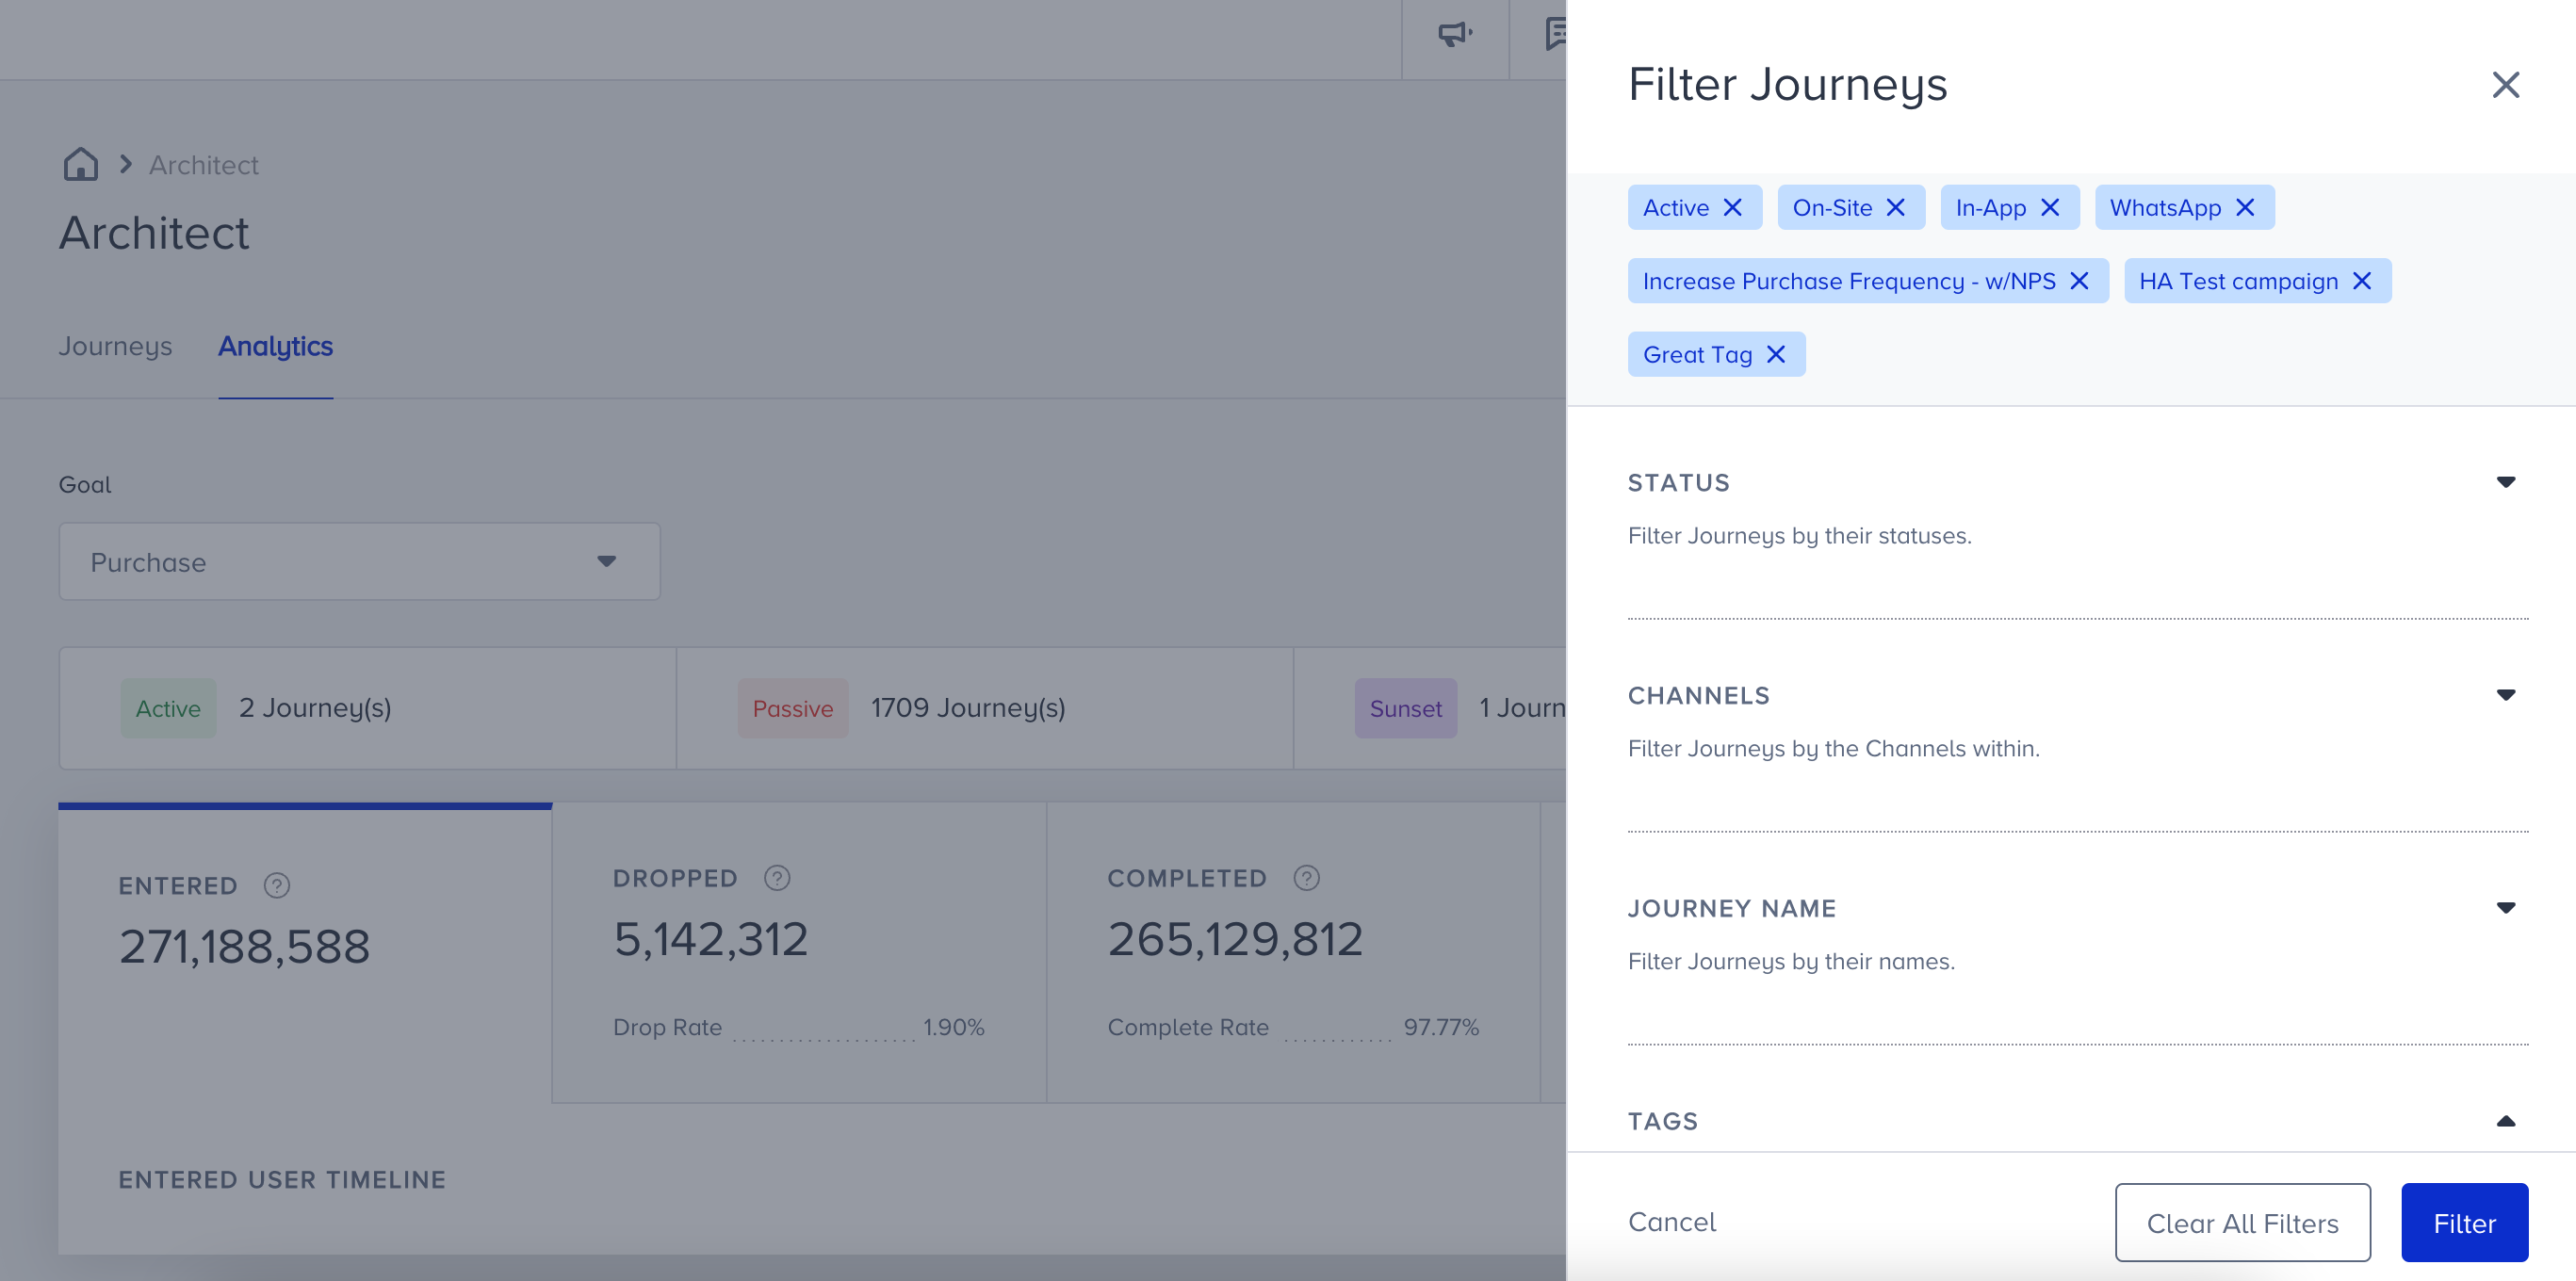
You can filter the dashboard by journey status, including channels, journey names, and journey tags. Filtering allows you to get meaningful data.
your title goes here
Analytics dashboard displays only active journeys by default. You can add other statuses by clicking the Filter button.
Your title goes here
When you change a journey flow, the analytics of the journey generated before the change is not stored. If you need to change the journey flow for any reason, the best way to do it is to follow these steps:
- Duplicate the journey,
- Sunset the original journey,
- Make the necessary changes to the duplicated journey and launch.
To export the results, click the Export button. This way, you can get your results with the selected filters..png)
For each journey, you can define your desired goal that you expect users to perform after clicking a message through the journey. Goals can be defined from events no matter if a default or a custom event you created before. Read more on Set Goals.
your title goes here
Purchase activity is always tracked by default in the journey even if you do not choose purchase as the goal. You can always see the purchase activity as a conversion metric on the statistics pages (if you have online-selling on your web/mobile).
If you select a goal other than purchase for your journeys, this goal is included in the dropdown. You can also view the conversion and conversion rate metrics by selecting another goal.
If you have a specified event parameter of the event as a conversion goal, you can see it on the Conversion Goal dropdown.
Number of Journeys
You can see how many journeys you have on different statuses. Analytics dashboard displays only active journeys by default. You will see only the count of the active journeys initially. To add other statuses, click the Filter button.
Live Stats
Live stats offer the following metrics:

- Entered: The number of users who became eligible and started the journeys.
- Dropped: The number of users who got dismissed from the journeys due to channel reachability.
- Drop rate: The percentage of the users who dropped from the channels and "not reachable" path to the users who entered the journeys.
- Completed: The number of users who finished the journeys by reaching the last element or an empty path.
- Complete rate: The total number of completed is divided by the number of the total entered of all journeys.
- Exited: The number of users who got dismissed from the journeys by matching the exit criteria.
- Sent: The number of messages addressed to the users via all channels in all journeys.
You can click on the metrics to see the timeline of each Entered, Dropped, Completed, Exited, and Sent metrics.
All Journeys Analytics
This section offers total clicks, click-through rate, total conversions, conversion rate, total revenue metrics, and their trends in a time interval.
.png) | Total Clicks is the total number of times that the users clicked the messages via all channels in the journey. On the chart, you can see how many clicks the journey received based on their dates. |
.png) | Total Conversions is the total number of successful goal accomplishments via all channels in the journey. On the graph, you can see how many conversions journey received based on their dates. |
.png) | Total Revenue is the total value of purchases made via all channels in the journey. On the graph, you can see the total revenue amount of the journey got by conversions. Average Order Value is the division of revenue by the number of purchases made via all channels in all journeys. |
You can see the incremental or decremental changes in click, conversion, revenue, and average order value based on the selected date range. For example, when you select "last month", it will compare the last month to the previous month. When you select 7 days on the date picker, it will compare the selected 7 days to the previous 7 days.
Your title goes here
You can select a period of time up to 6 months since only the prior data of 6 months to be compared is available.
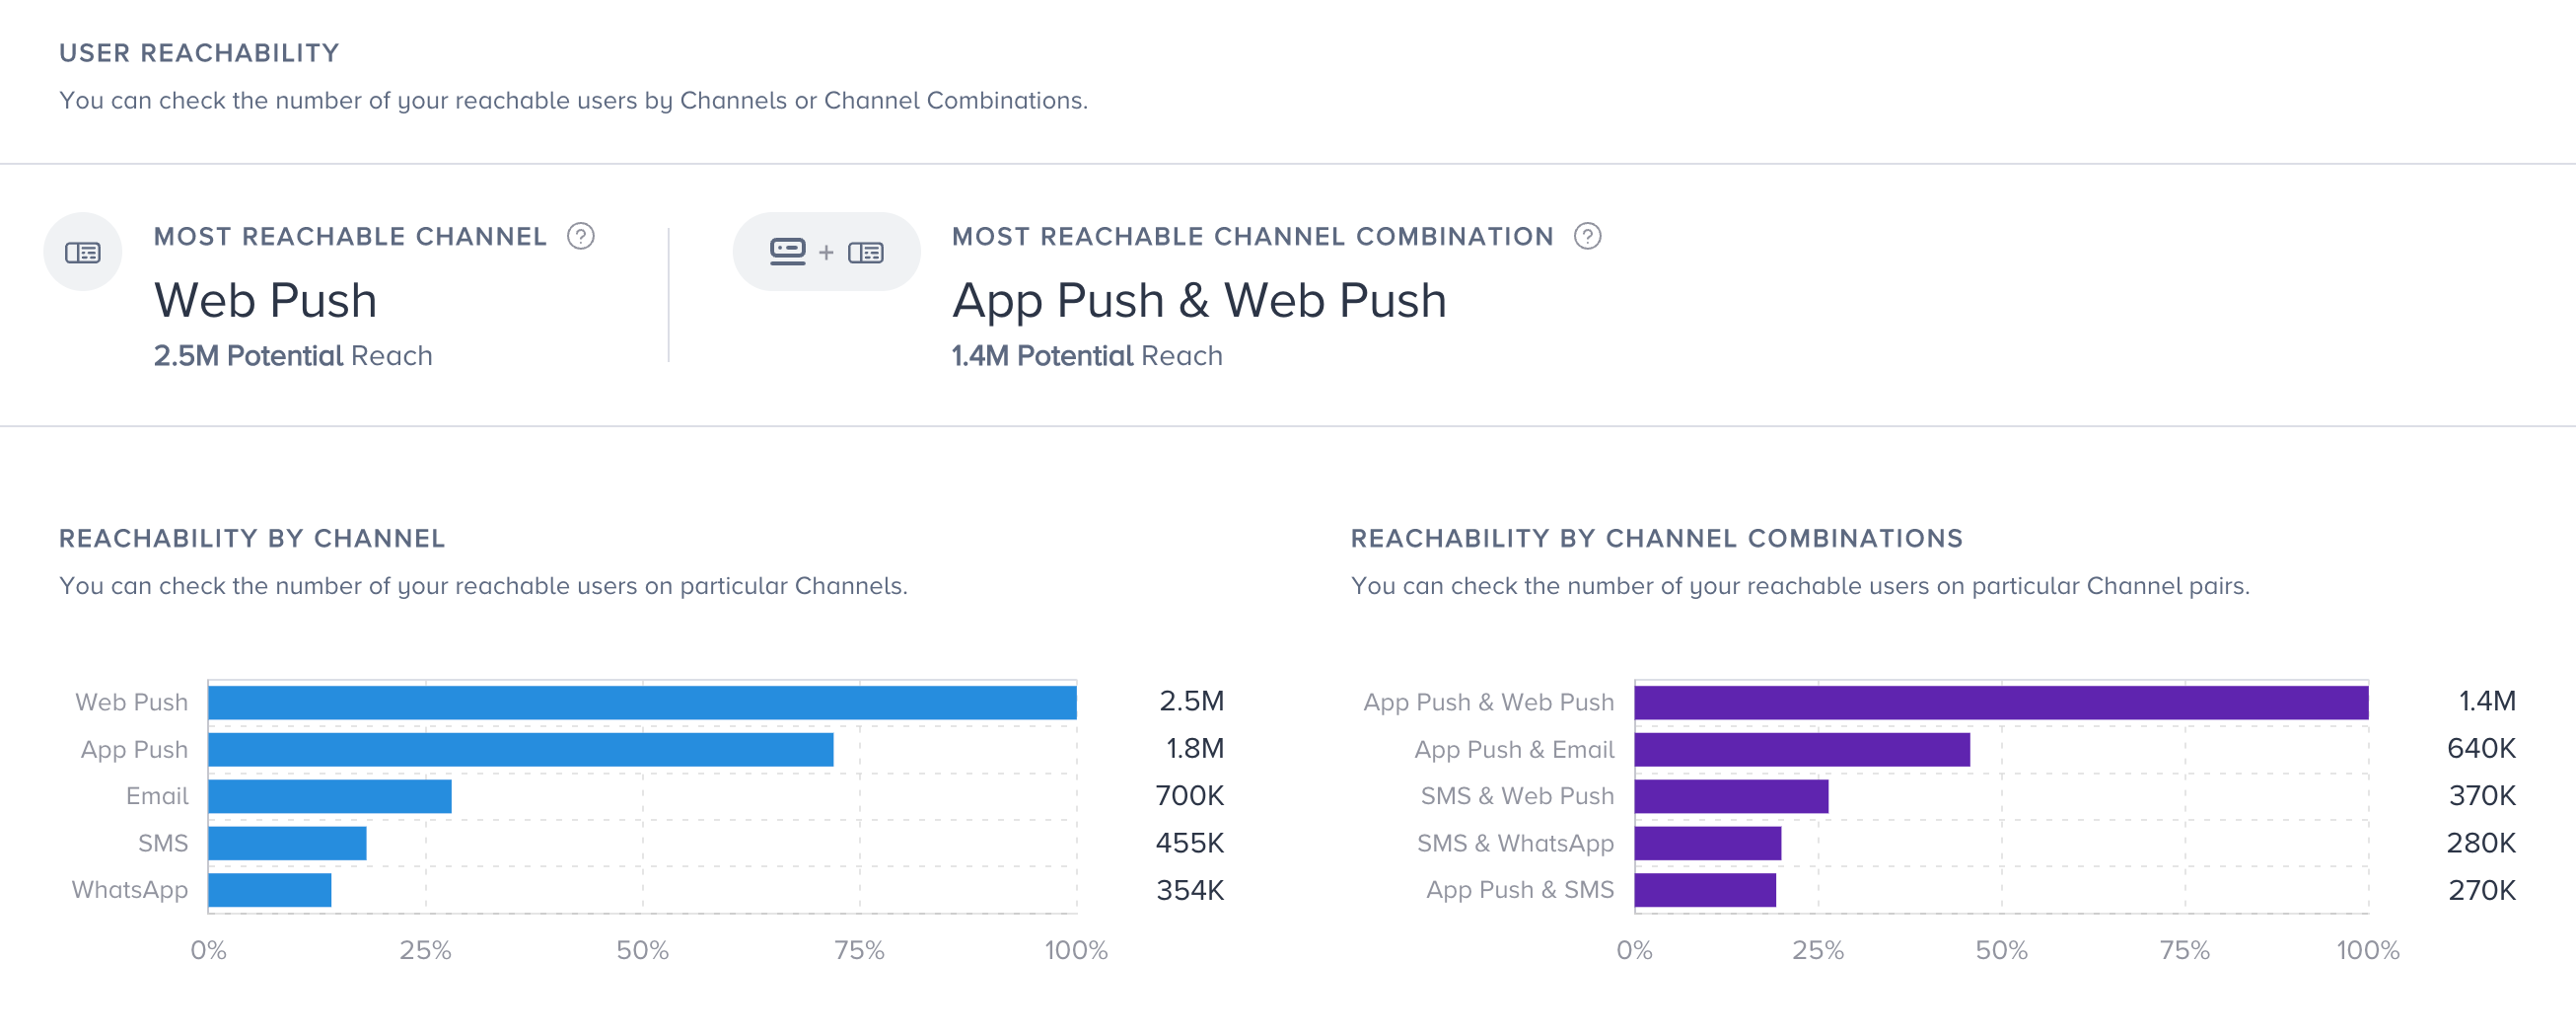
User Reachability
User Reachability section lets you see the number of reachable users on each channel and channel combinations.
The number of reachable users on a single channel is compared to the total number of users that can be reached potentially. You can see the top channel combinations of your channels in terms of users who are reachable on both channels.
your title goes here
These metrics do not provide the number of users that were reachable while the journey was sending messages, but a general reachability data that offers you an insight about users to consider while designing your journey.
Refer to Reachability on Channels to see how reachability is calculated and detected differently for each channel.
Performance of Channels
You can evaluate the trends of Sent, Delivered, Drops, Clicks, Conversions and Revenue for each channel you sent messages through all journeys.
You can compare all the channels that you use in your journeys based on a performance metric that you choose. In the Channels dropdown on the top right of the chart, you can select the channels and view their daily, weekly or monthly data.
This section provides the channels that you use in all journeys along with their metrics.

If a channel is used three times in all journeys, its metrics are gathered and displayed in this section. This way, you can use compare such channels with others.
You can also select the metrics in the dropdown to remove the available metrics from the table. You can scroll left and right on the table to see all metrics, and sort them with the sorting button against each metric.

- Use: The number of times that a channel type is utilized in all journeys.
- Sent: The number of messages addressed to the users via a channel.
- Delivered: The number of messages delivered to the users via a channel in all journeys. Impressions are counted as Delivered for the on-site and in-app channels.
- Dropped: The number of users who got dismissed from the journeys due to channel reachability.
- Drop rate: The percentage of the users who dropped from the channel to the users who arrived at the channel in all journeys.
- Total Opens: The total number of times that the users opened the Email.
- Unique Opens: The unique number of times that the users opened the Email.
- Open rate: The percentage of users who opened the Email(s) in all journeys.
- Total Clicks: The number of times that the users clicked the messages via a channel.
- Unique Clicks: The unique number of times that the users clicked the Email.
- Click-through rate: The percentage of times that the users clicked the messages to the sent messages via a channel.
- Conversions: The number of successful goal accomplishments via a channel.
- Conversion Rate: The percentage of the successful goal accomplishments to the delivered messages via a channel.
- Revenue: The value of purchases made via a channel.
- Average Order Value: The division of Revenue by the number of purchases made via a channel in all journeys.
Performance of Journeys
This section provides all journeys with their metrics based on the filter you select at the top of the page.
You can search for your journey in the top right corner, and click it to see the journey flow on the new tab. You can select the metrics in the dropdown, add and remove the available metrics from the table, and scroll left and right on the table to see all metrics.
This table displays the following information and metrics:
- Status: Indicates the current status of the journey.
- Name: Shows the journey name.
- Sent: The number of messages addressed to the users via all channels in the journey.
- Delivered: The number of messages delivered to the users via all channels in the journey. Impressions are counted as Delivered for the on-site and in-app channels.
- Drops: The number of users who got dismissed from the journey due to channel reachability.
- Drop Rate: The percentage of the users who dropped from the channels and "not reachable" path to the users who entered the journey.
- Opens: The unique number of times that the users opened the Email(s) in the journey.
- Open Rate: The percentage of users who opened the Email(s) in the journey.
- Clicks: The number of times that the users clicked the messages via all channels in the journey.
- Click-Through Rate: The percentage of times that the users clicked the messages to the sent messages via all channels in the journey.
- Conversions: The number of successful goal accomplishments via all channels in the journey.
- Conversion Rate: The percentage of the successful goal accomplishments to the sent messages via all channels in the journey.
- Revenue: The value of purchases made via all channels in the journey.
Was this article helpful?