Campaign-Level App Push Analytics
- 04 Apr 2024
- 6 Minutes to read
Campaign-Level App Push Analytics
- Updated on 04 Apr 2024
- 6 Minutes to read
Article Summary
Share feedback
Thanks for sharing your feedback!
Campaign-Level App Push Analytics page provides realtime insights about your app push campaign, and helps you get a better understanding of your campaign strategy.
On this page, you can narrow down the filters of the campaign to see more related data.
To see your analytics, click the See Analytics button against the campaign you want to see details about.
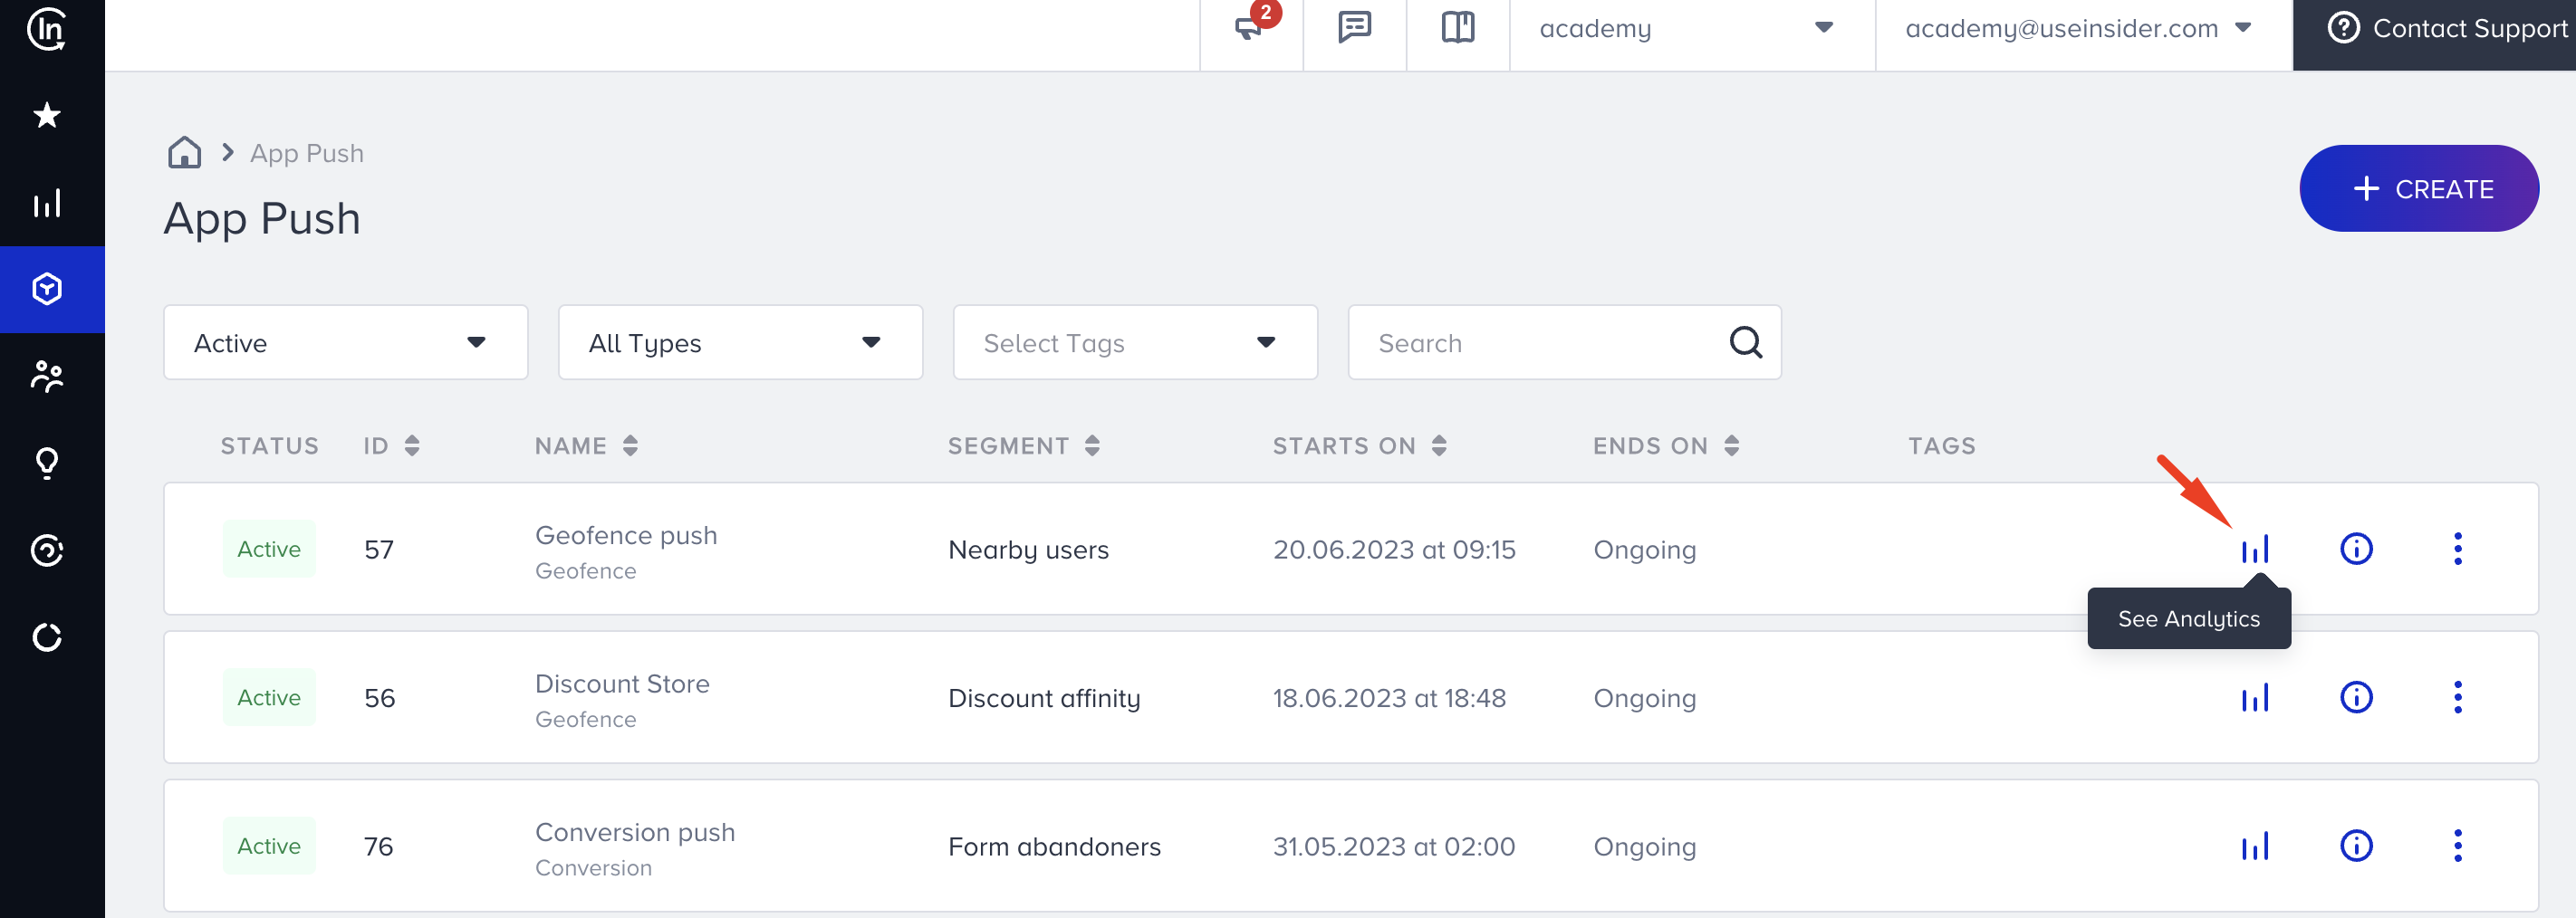
The analytics dashboard consists of 4 sections: Pre-filters, Summary Metrics, Pie Chart & Graphs, and Variant List.
Pre-filters
You can apply Goal, Report Type, Platform, and Date Range pre-filters to your data to see the related insights. Each filter will have a default selected option. You can change these preferences to view the respective data.
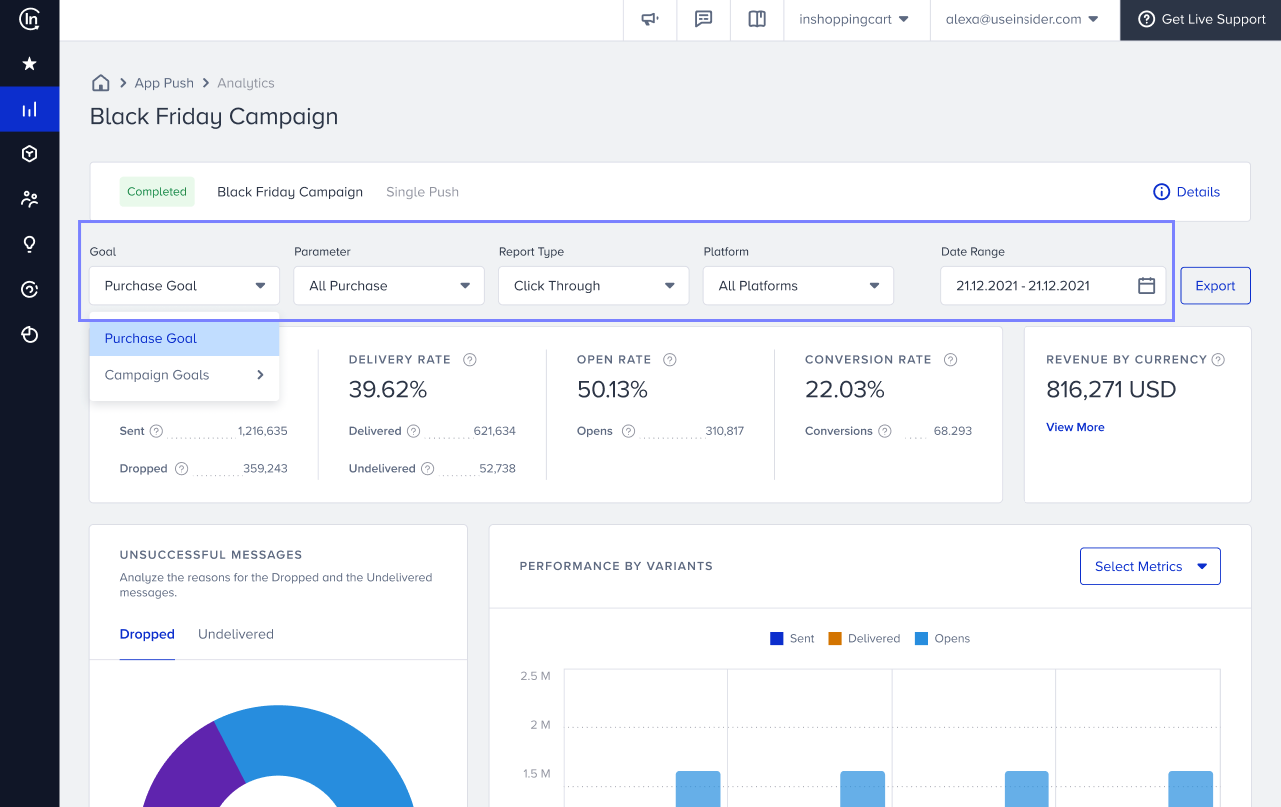
Goal
This option allows you to calculate your conversions via the selected event. Only the defined campaign goal metrics for the respective campaign are listed in this dropdown. Conversions and Conversion Rate are calculated based on the selected event.
Platform
You can see 3 platform options: All Platforms, iOS, and Android. You can see the results according to the device platform types.
Date Range
You can select specific date ranges to view your data. When you select a different time range, if there is any metric data for the respective campaign, it is displayed on the page and contributes to the metrics overall.
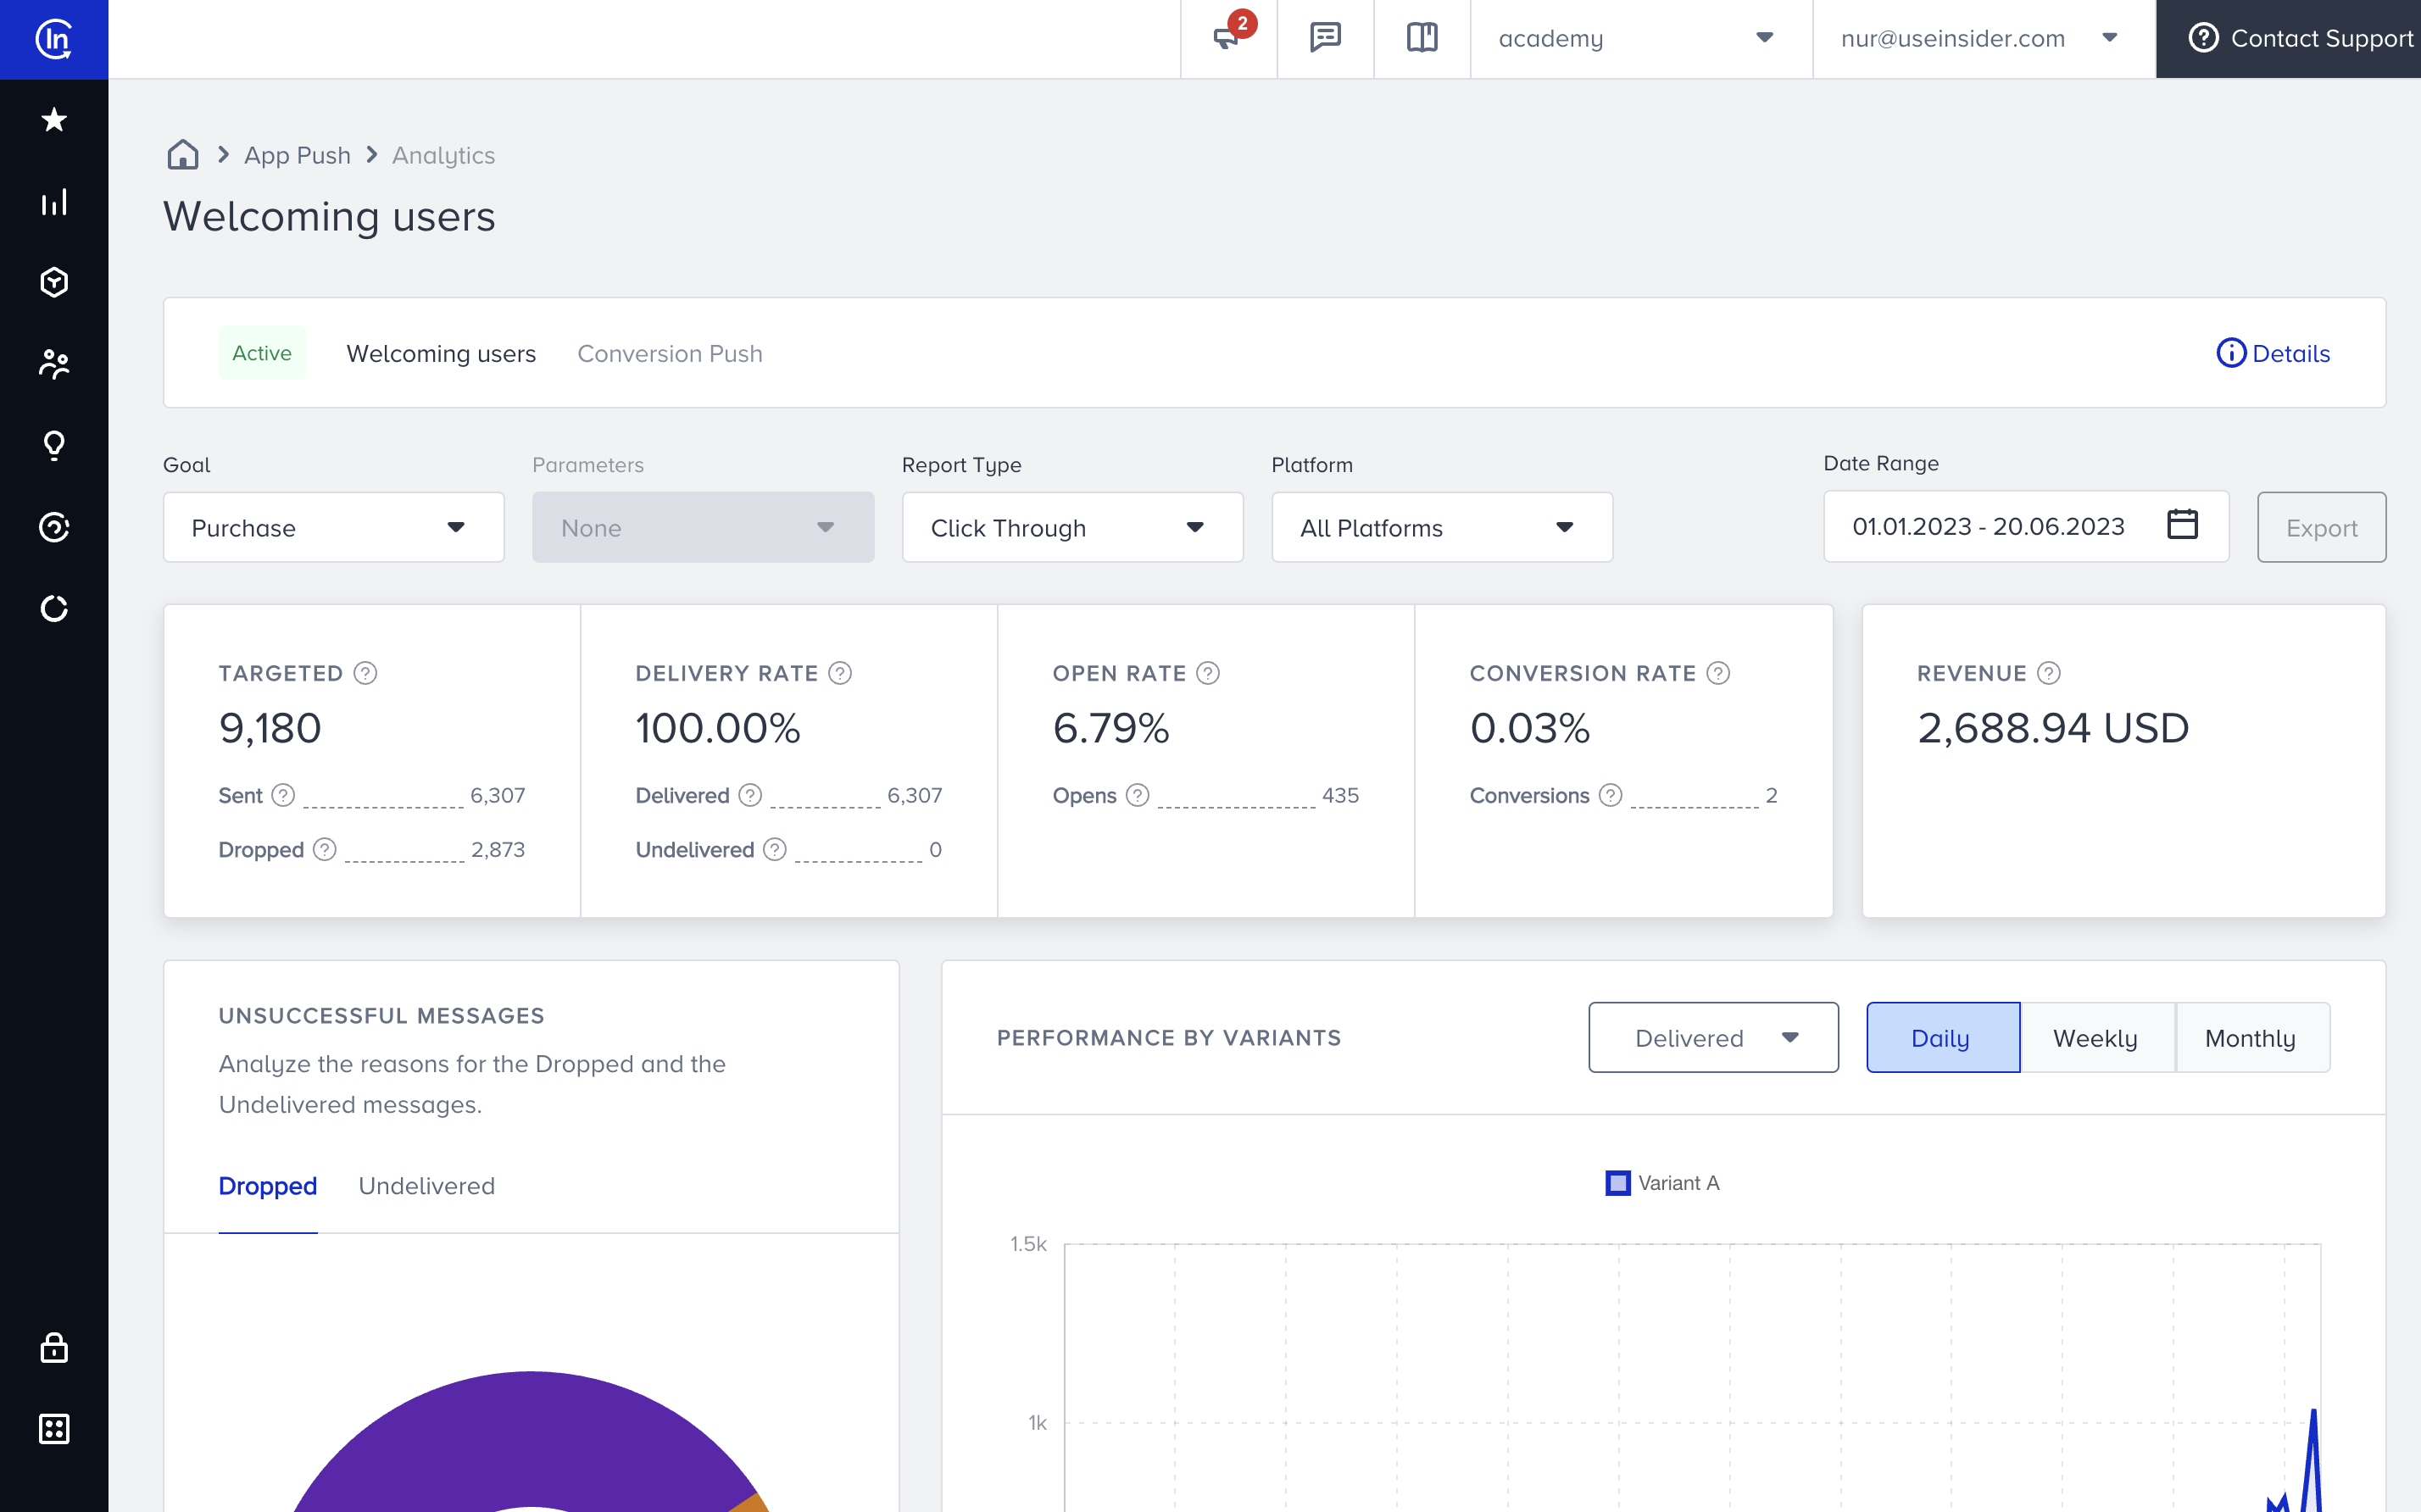
Summary Metrics
You can see the summary metrics above the graphs. These metrics are the most important metrics for your app push campaigns, and help you get an overall idea about your campaigns.
Summary metrics are Targeted, Delivery Rate, Open Rate, Conversion Rate, and Revenue.
- Targeted: The number of recipients in your target audience generated based on the segmentation of your campaigns. Targeted is the sum of Sent and Dropped.
- Sent: The number of app push messages successfully transferred to the service provide to be addressed to the recipients. Sent is the sum of Delivered and Undelivered messages.
- Dropped: The number of app push messages that were not transferred to the service provider to be addressed to the recipients.
- Delivery Rate: The percentage of the Delivered to the Sent app push messages. Delivery Rate is Delivered/Sent.
- Delivered: The number of app push messages successfully transferred to the recipients.
- Undelivered: The number of app push messages that were not addressed to the recipients by the service provider.
- Open Rate: The percentage of the Opens to the Delivered app push messages. Open Rate is Opens/Delivered.
- Opens: The number of app push messages opened by the recipients.
- Conversion Rate: The percentage of the Conversions to the Delivered app push messages. Conversion Rate is Conversions/Delivered.
- Conversions: The number of successful goal accomplishments.
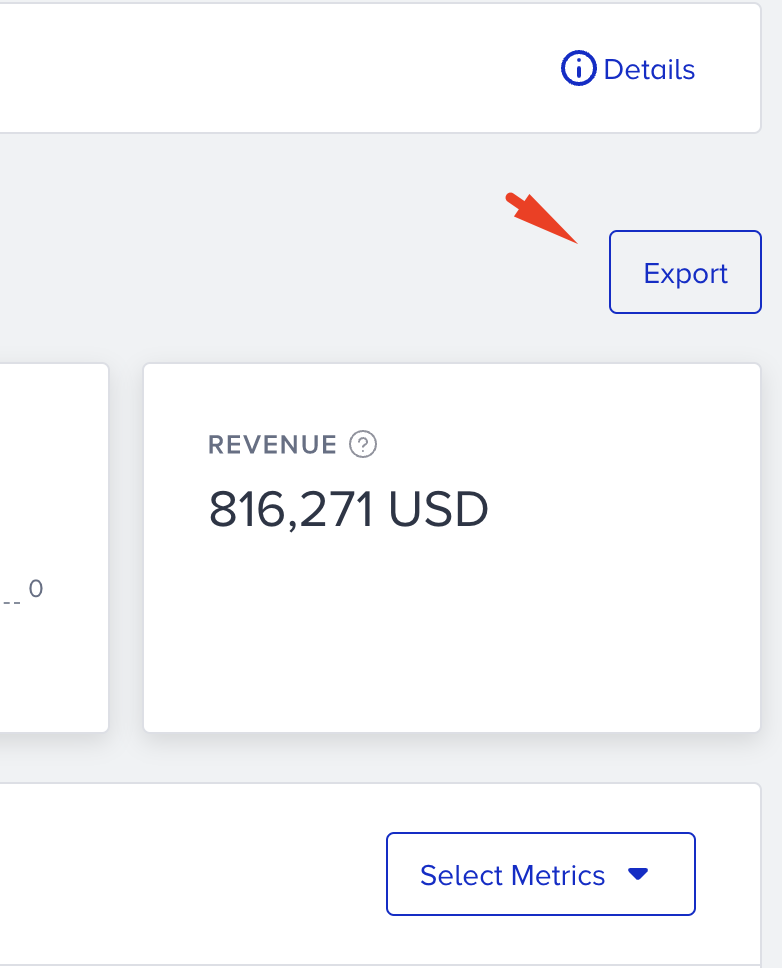
- Revenue: The value of purchases made via your app push message.
Pie Chart & Graphs
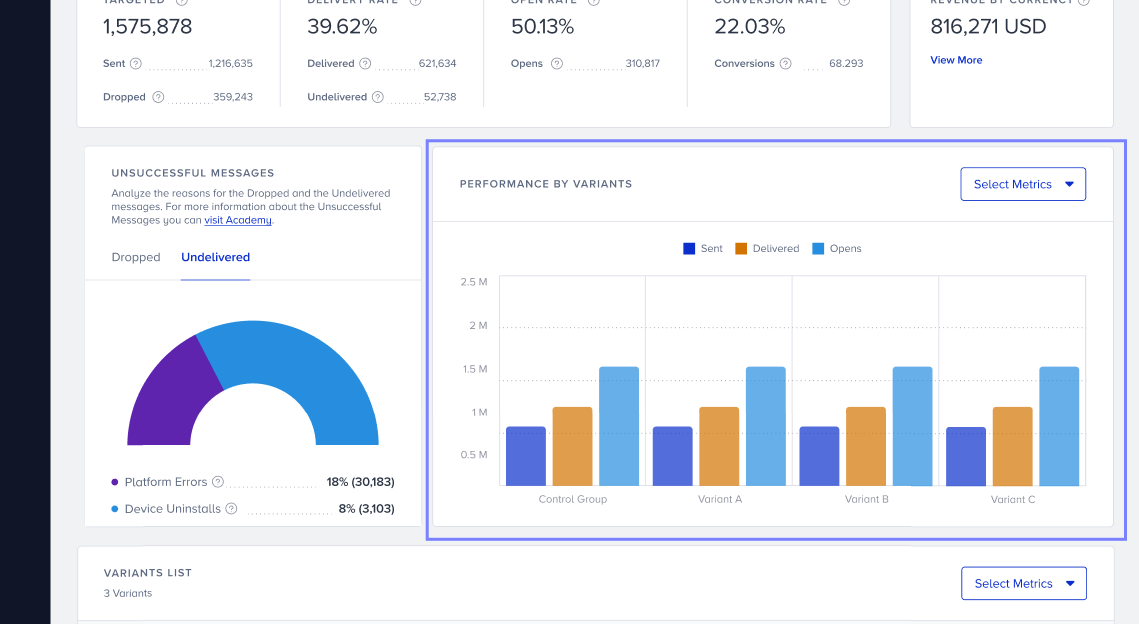
You can see the details of your unsuccessful messages, and performance of your variants in pie charts and graphs.
Pie Chart
This pie chart gives insights about the unsuccessful messages of sent app push notifications. The app pushes may not have been delivered due to several reasons. This chart reports these messages with a breakdown of Dropped and Undelivered.

Dropped
There may be 3 reasons for dropped messages:
- Silent Hours: The percentage (and the number) of the Dropped messages due to the Silent Hours settings.
- Re-Eligibility Duration: The percentage (and the number) of the Dropped messages due to the Re-Eligibility settings.
- Frequency Capped: The percentage (and the number) of the Dropped messages due to the Channel Frequency Capping settings.
Undelivered
There may be 2 reasons for undelivered messages:
- Device Uninstalls: The percentage (and the number) of the Undelivered messages due to the recipients who uninstalled your app from their devices.
- Delivery Issues: The percentage (and the number) of Undelivered messages due to various errors on recipients’ devices.
    MissingRegistrationStatus       // Check that the request contains a registration token (in the registration_id in a plain text message, or in the to or registration_ids field in JSON
	InvalidRegistrationStatus       // Registration token does not match the registration token the client app receives from registering with FCM.
	NotRegisteredStatus             // Unregistered means the user deleted the app. On Android 8 and higher, each installation generates a new identifier/token. You may need to add your device to test devices again.
	InvalidPackageNameStatus        // Make sure the message was addressed to a registration token whose package name matches the value passed in the request.
	AuthenticationErrorStatus       // The sender account could not be authenticated. Could be due to: missing header or with invalid syntax in HTTP request, Invalid project number, disabled FCM service, Server Key IP whitelist problem.
	MismatchSenderIDStatus          // Sender ID does not match the registered Sender ID on FCM.
	InternalServerErrorStatus       // The server encountered an error while trying to process the request.
	PayloadEmptyStatus              // The message payload was empty.
	PayloadTooLargeStatus           // The message payload was too large. The maximum payload size is 4096 bytes.
	BadTopicStatus                  // The apns-topic was invalid.
	TopicDisallowedStatus           // Pushing to this topic is not allowed.
	BadMessageIDStatus              // The apns-id value is bad.
	BadExpirationDateStatus         // The apns-expiration value is bad.
	BadPriorityStatus               // The apns-priority value is bad.
	MissingDeviceTokenStatus        // The device token is not specified in the request
	CertificateIssueStatus          // Your APNS certificate is either corrupted or do not exist
	BadDeviceTokenStatus            // The specified device token was bad. Verify that the request contains a valid token and that the token matches the environment.
	DeviceTokenNotForTopicStatus    // The device token does not match the specified topic.
	UnregisteredStatus              // Unregistered means the user deleted the app. On iOS, each installation generates a new identifier/token. You may need to add your device to test devices again.
	DuplicateHeadersStatus          // One or more headers were repeated.
	BadCertificateEnvironmentStatus // The client certificate was for the wrong environment.
	BadCertificateStatus            // The certificate was bad.
	ForbiddenStatus                 // The specified action is not allowed.
	TooManyRequestsStatus           // Too many requests were made consecutively to the same device token.
	IdleTimeoutStatus               // Idle time out.
	MissingTopicStatus              // The apns-topic header of the request was not specified and was required. The apns-topic header is mandatory when the client is connected using a certificate that supports multiple topics.
	NoDeviceTokenStatus             // User did not allow push notification.
	NoGDPRConsentStatus             // Please make sure the GDPR value is 'true' for the user
Any device uninstalls between two ghost pushes will show on the campaign-level analytics. Refer to App Uninstall Analytics for further information on uninstalls.
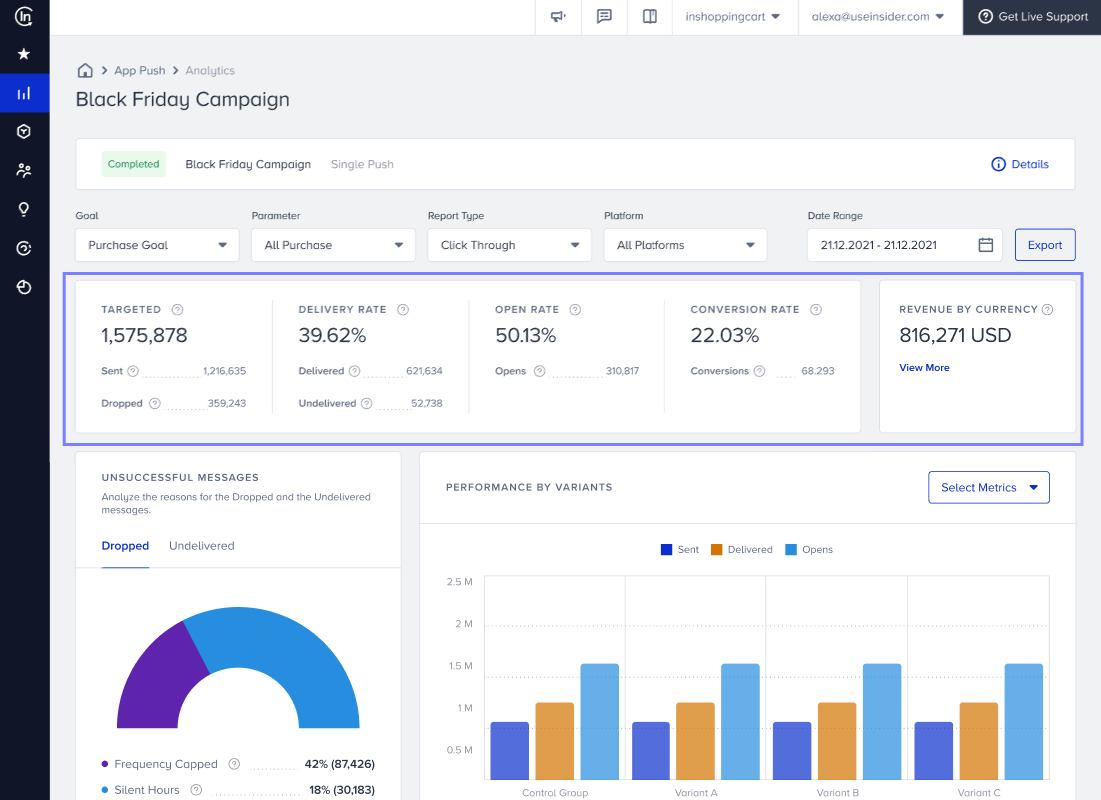
Performance by Variants Graph
You can view the Sent, Delivered, and Opens metrics of your campaign based on the selected date range. This graph helps you see these metrics with a variant breakdown.
Variant List
Variant List displays all details belonging to the respective campaign with a breakdown of variants. The selected pre-filters, goals, and date range are also applied to this table.
You can select the metrics you want to see via the Select Metrics option in the right top corner.
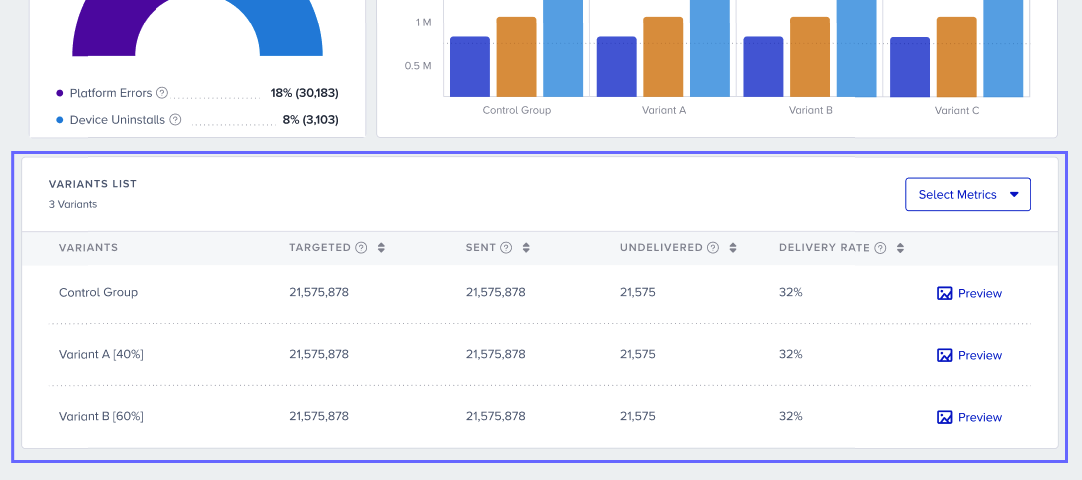
This table displays the following details and metrics:
- Variants: Variant names listed in this column. It an be a Control Group or a Variant.
- Targeted: The number of recipients in your target audience generated based on the segmentation of your campaign.
- Sent: The number of App Push messages successfully transferred to the service provider to be addressed to the recipients.
- Dropped: The number of App Push messages that were not transferred to the service provider to be addressed to the recipients.
- Re-eligibility: The percentage (and the number) of Dropped messages due to the Re-Eligibility settings.
- Silent Hours: The percentage (and the number) of the Dropped messages due to the Silent Hours settings.
- Delivery Rate: The percentage of the Delivered to the Sent App Push messages.
- Delivered: The number of App Push messages successfully transferred to the recipients.
- Undelivered: Te number of App Push messages that were not addressed to the recipients by the service provider.
- Delivery Issues: The percentage (and the number) of Undelivered messages due to various errors on recipients’ devices.
- Device Uninstalls: The percentage (and the number) of Undelivered messages due to the recipients who uninstalled your app from their devices.
- Open Rate: The percentage of the Opens to the Delivered App Push messages.
- Opens: The number of App Push messages opened by the recipients.
- Conversion Rate: The percentage of the Conversions to the Delivered App Push messages.
- Conversions: The number of successful goal accomplishments.
- Revenue: The value of purchases made via your App Push messages.
- Primary Goals: The goal selected as Primary Goal for the App Push campaign.
- Segment: The segment used for the App Push campaign.
- Rule: The rule used for the App Push campaign.
- Starts On: The date the campaign started.
- Ends On: The date the campaign ended.
- Tags: The tag(s) used for the App Push campaign.
Export
To export your analytics, click the Export button. You will receive the exported report in your email address.
Was this article helpful?